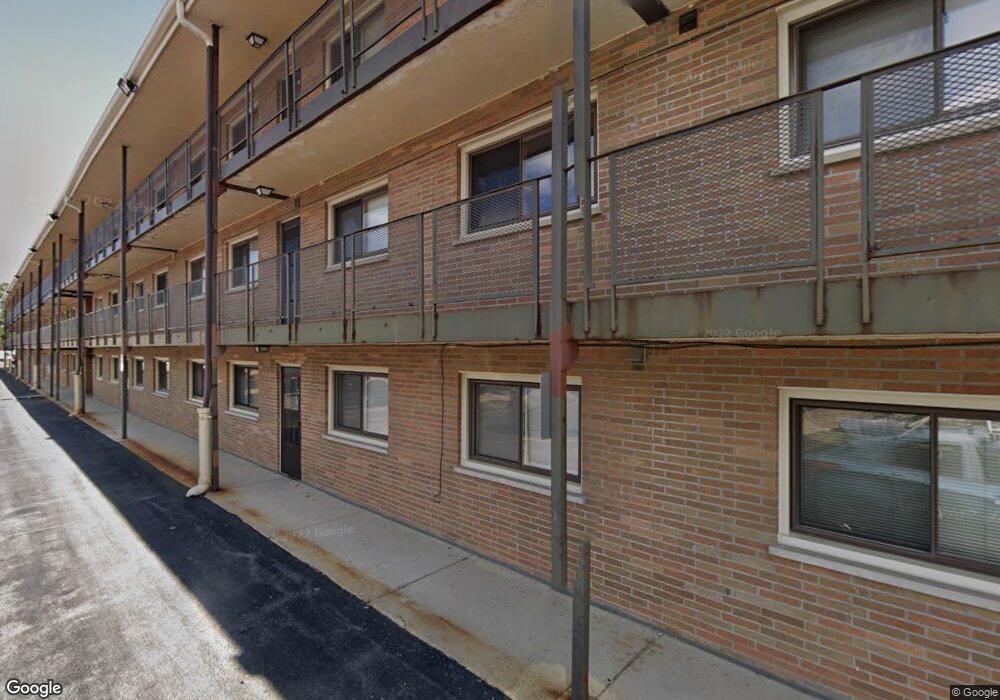
9612 W Higgins Rd Unit 2E Rosemont, IL 60018
Estimated Value: $206,000 - $215,000
1
Bed
--
Bath
928
Sq Ft
$228/Sq Ft
Est. Value
About This Home
This home is located at 9612 W Higgins Rd Unit 2E, Rosemont, IL 60018 and is currently estimated at $211,212, approximately $227 per square foot. 9612 W Higgins Rd Unit 2E is a home located in Cook County with nearby schools including Rosemont Elementary School, East Leyden High School, and Mary, Seat Of Wisdom School.
Ownership History
Date
Name
Owned For
Owner Type
Purchase Details
Closed on
Apr 21, 2021
Sold by
Glasso Patrick D and Glasso Alexandra
Bought by
Meraz Cynthia M and Meraz Alondra N
Current Estimated Value
Home Financials for this Owner
Home Financials are based on the most recent Mortgage that was taken out on this home.
Original Mortgage
$173,850
Outstanding Balance
$156,636
Interest Rate
2.87%
Mortgage Type
New Conventional
Estimated Equity
$54,576
Purchase Details
Closed on
Nov 18, 2018
Sold by
Genauldi Dennis
Bought by
Glasso Patrick D
Home Financials for this Owner
Home Financials are based on the most recent Mortgage that was taken out on this home.
Original Mortgage
$104,500
Interest Rate
4.75%
Mortgage Type
New Conventional
Purchase Details
Closed on
Mar 24, 1995
Sold by
Genualdi Salvatore
Bought by
Genualdi Salvatore and Genualdi Marie
Create a Home Valuation Report for This Property
The Home Valuation Report is an in-depth analysis detailing your home's value as well as a comparison with similar homes in the area
Home Values in the Area
Average Home Value in this Area
Purchase History
| Date | Buyer | Sale Price | Title Company |
|---|---|---|---|
| Meraz Cynthia M | $183,000 | Attorney | |
| Glasso Patrick D | $110,000 | Chicago Title | |
| Genualdi Salvatore | -- | -- |
Source: Public Records
Mortgage History
| Date | Status | Borrower | Loan Amount |
|---|---|---|---|
| Open | Meraz Cynthia M | $173,850 | |
| Previous Owner | Glasso Patrick D | $104,500 |
Source: Public Records
Tax History Compared to Growth
Tax History
| Year | Tax Paid | Tax Assessment Tax Assessment Total Assessment is a certain percentage of the fair market value that is determined by local assessors to be the total taxable value of land and additions on the property. | Land | Improvement |
|---|---|---|---|---|
| 2024 | $2,260 | $12,081 | $1,176 | $10,905 |
| 2023 | $2,302 | $12,081 | $1,176 | $10,905 |
| 2022 | $2,302 | $12,081 | $1,176 | $10,905 |
| 2021 | $2,435 | $11,378 | $833 | $10,545 |
| 2020 | $2,487 | $11,378 | $833 | $10,545 |
| 2019 | $2,277 | $12,645 | $833 | $11,812 |
| 2018 | $2,784 | $10,244 | $735 | $9,509 |
| 2017 | $2,841 | $10,244 | $735 | $9,509 |
| 2016 | $1,387 | $10,244 | $735 | $9,509 |
| 2015 | $1,508 | $11,834 | $637 | $11,197 |
| 2014 | $1,475 | $11,834 | $637 | $11,197 |
| 2013 | $1,380 | $11,834 | $637 | $11,197 |
Source: Public Records
Map
Nearby Homes
- 9614 W Higgins Rd Unit 3A
- 2993 Curtis St Unit C41
- 1840 Nimitz Dr
- 2500 Windsor Mall Unit 1J
- 500 Thames Pkwy Unit 1F
- 2300 Windsor Mall Unit 1F
- 2300 Windsor Mall Unit 2E
- 2609 Eisenhower Dr
- 2166 Laura Ln
- 1757 Farwell Ave
- 414 S Dee Rd Unit 13
- 1966 Laura Ln
- 200 Thames Pkwy Unit 1
- 2646 Maple St
- 38 E Touhy Ave
- 929 S Aldine Ave
- 1219 S Western Ave
- 60 S Dee Rd Unit G
- 516 Engel Blvd
- 20 S Dee Rd
- 9610 W Higgins Rd Unit 1C
- 9612 W Higgins Rd Unit 3F
- 9610 W Higgins Rd Unit 1B
- 9612 W Higgins Rd Unit 1F
- 9610 W Higgins Rd Unit 3A
- 9612 W Higgins Rd Unit 1D
- 9612 W Higgins Rd Unit 2F
- 9610 W Higgins Rd Unit 3B
- 9610 W Higgins Rd Unit 2B
- 9612 W Higgins Rd Unit 2D
- 9612 W Higgins Rd Unit 1E
- 9612 W Higgins Rd Unit 3E
- 9612 W Higgins Rd Unit 3D
- 9610 W Higgins Rd Unit 1A
- 9610 W Higgins Rd Unit 3C
- 9610 W Higgins Rd Unit 2A
- 9610 W Higgins Rd Unit 2C
- 9606 W Higgins Rd Unit 3C
- 9606 W Higgins Rd Unit 3F
- 9606 W Higgins Rd Unit 2D