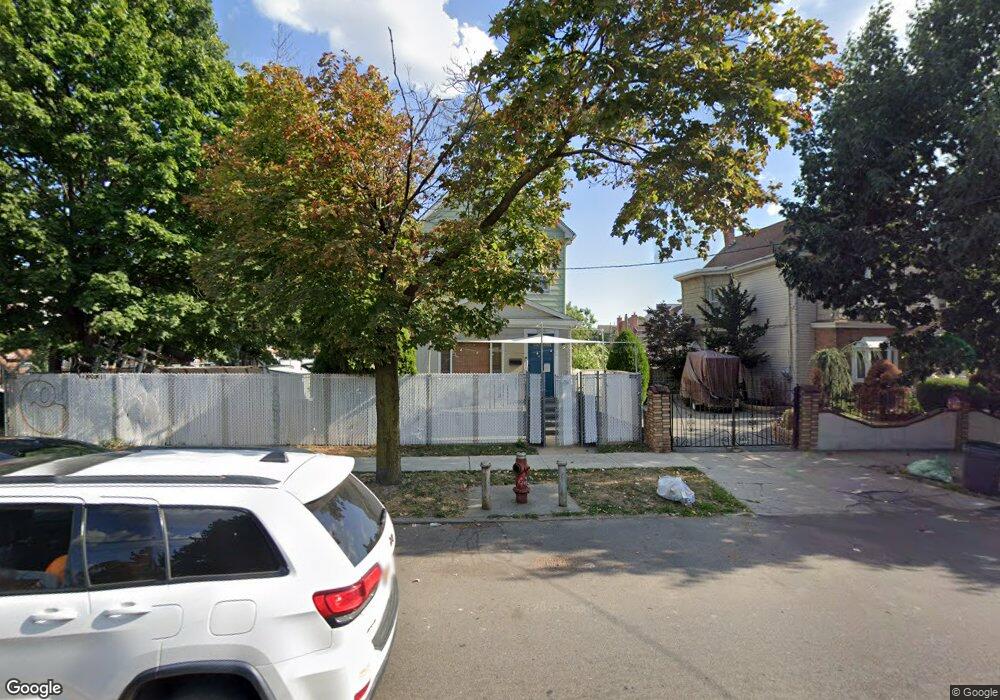
9616 103rd Ave Ozone Park, NY 11417
Ozone Park NeighborhoodEstimated Value: $761,579 - $895,000
--
Bed
--
Bath
1,324
Sq Ft
$612/Sq Ft
Est. Value
About This Home
This home is located at 9616 103rd Ave, Ozone Park, NY 11417 and is currently estimated at $809,895, approximately $611 per square foot. 9616 103rd Ave is a home located in Queens County with nearby schools including P.S. 65 - The Raymond York Elementary School, Robert H. Goddard High School, and Divine Mercy Catholic Academy.
Ownership History
Date
Name
Owned For
Owner Type
Purchase Details
Closed on
Mar 1, 2013
Sold by
Cuevas Robert
Bought by
Pramanand Diana and Pramanand Narendranauth
Current Estimated Value
Purchase Details
Closed on
Apr 30, 2001
Sold by
Khan Shenaz and Roopchan Chaterau
Bought by
Cuevas Robert and Abud-Cuevas Ramona
Home Financials for this Owner
Home Financials are based on the most recent Mortgage that was taken out on this home.
Original Mortgage
$304,000
Interest Rate
7.03%
Purchase Details
Closed on
Jul 28, 2000
Sold by
Guiliano Angelo and Guiliano Joseph
Bought by
Khan Shenaz and Roopchan Chateram
Home Financials for this Owner
Home Financials are based on the most recent Mortgage that was taken out on this home.
Original Mortgage
$186,300
Interest Rate
8.16%
Purchase Details
Closed on
Jan 22, 1999
Sold by
Commisso Lena
Bought by
Guiliano Angelo and Guiliano Joseph
Create a Home Valuation Report for This Property
The Home Valuation Report is an in-depth analysis detailing your home's value as well as a comparison with similar homes in the area
Home Values in the Area
Average Home Value in this Area
Purchase History
| Date | Buyer | Sale Price | Title Company |
|---|---|---|---|
| Pramanand Diana | $505,000 | -- | |
| Cuevas Robert | -- | -- | |
| Khan Shenaz | $207,000 | Regal Title | |
| Guiliano Angelo | -- | -- |
Source: Public Records
Mortgage History
| Date | Status | Borrower | Loan Amount |
|---|---|---|---|
| Previous Owner | Cuevas Robert | $304,000 | |
| Previous Owner | Khan Shenaz | $186,300 |
Source: Public Records
Tax History Compared to Growth
Tax History
| Year | Tax Paid | Tax Assessment Tax Assessment Total Assessment is a certain percentage of the fair market value that is determined by local assessors to be the total taxable value of land and additions on the property. | Land | Improvement |
|---|---|---|---|---|
| 2025 | $6,454 | $34,058 | $12,462 | $21,596 |
| 2024 | $6,454 | $32,131 | $11,443 | $20,688 |
| 2023 | $6,088 | $30,313 | $11,706 | $18,607 |
| 2022 | $5,709 | $49,440 | $18,420 | $31,020 |
| 2021 | $6,018 | $43,980 | $18,420 | $25,560 |
| 2020 | $6,008 | $43,140 | $18,420 | $24,720 |
| 2019 | $5,488 | $42,360 | $18,420 | $23,940 |
| 2018 | $5,149 | $25,261 | $13,302 | $11,959 |
| 2017 | $4,858 | $23,832 | $13,599 | $10,233 |
| 2016 | $4,764 | $23,832 | $13,599 | $10,233 |
| 2015 | -- | $23,652 | $11,381 | $12,271 |
| 2014 | -- | $22,314 | $12,895 | $9,419 |
Source: Public Records
Map
Nearby Homes
- 103-47 96th St
- 103-48 96th St
- 10333 Woodhaven Blvd
- 101-46 95th St
- 10330 102nd St
- 93-18 103rd Ave
- 103-50 102nd St
- 101-14 95th St
- 106-38 95th St
- 103-37 102nd St
- 10154 102nd St
- 92-17 Liberty Ave
- 103-18 103rd St
- 10719 96th St
- 92-18 Liberty Ave
- 103-58 103rd St
- 10370 103rd St
- 10723 96th St
- 100-08 101st Ave
- 10152 103rd St
- 9612 103rd Ave
- 10312 97th St
- 9610 103rd Ave
- 103-12 97th St
- 9610 103rd Ave
- 9610 103rd Ave Unit 2
- 97-18 103rd Ave Unit 2
- 10314 97th St
- 10305 97th St
- 9608 103rd Ave
- 9608 103rd Ave
- 10303 97th St
- 9608 103rd Ave
- 10307 97th St
- 103-5 97th St
- 103-7 97th St
- 10316 97th St
- 10311 96th St
- 9706 103rd Ave
- 10311 97th St