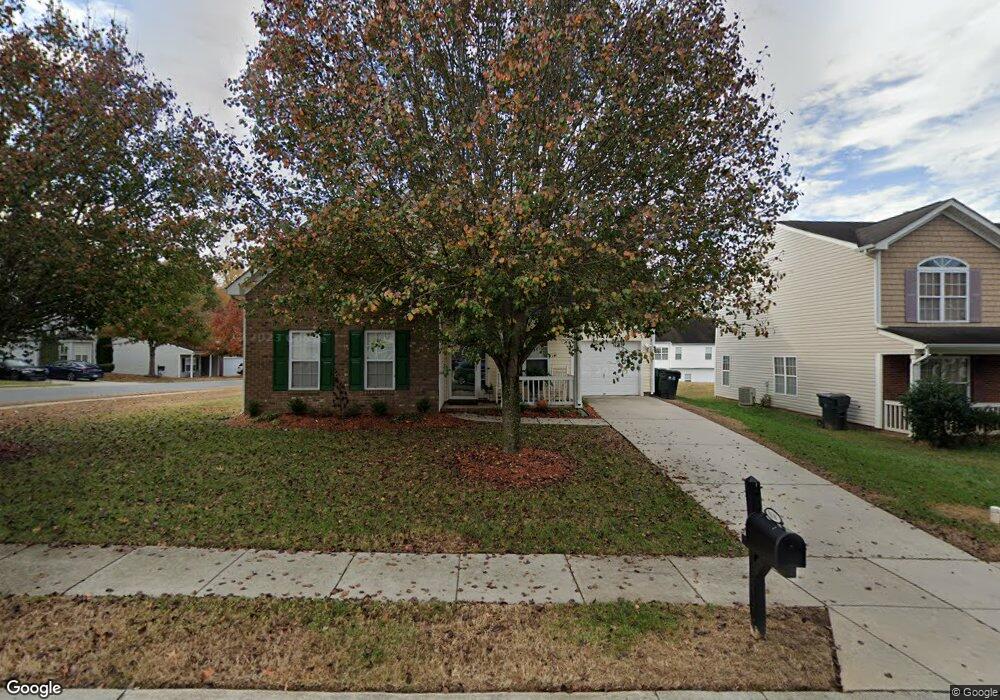
9616 Bradstreet Commons Way Charlotte, NC 28215
Silverwood NeighborhoodEstimated Value: $371,000 - $395,000
5
Beds
3
Baths
2,071
Sq Ft
$183/Sq Ft
Est. Value
About This Home
This home is located at 9616 Bradstreet Commons Way, Charlotte, NC 28215 and is currently estimated at $378,326, approximately $182 per square foot. 9616 Bradstreet Commons Way is a home located in Mecklenburg County with nearby schools including Reedy Creek Elementary School, Northridge Middle School, and Rocky River High School.
Ownership History
Date
Name
Owned For
Owner Type
Purchase Details
Closed on
Sep 21, 2016
Sold by
Fryar Kerel J and Fryar Danielle
Bought by
Mcqueen Denish L and Mcqueen Jacqueline
Current Estimated Value
Home Financials for this Owner
Home Financials are based on the most recent Mortgage that was taken out on this home.
Original Mortgage
$164,957
Outstanding Balance
$133,592
Interest Rate
3.87%
Mortgage Type
FHA
Estimated Equity
$244,734
Purchase Details
Closed on
Sep 22, 2004
Sold by
Brookwood Home Builders Inc
Bought by
Fryar Kerel J
Home Financials for this Owner
Home Financials are based on the most recent Mortgage that was taken out on this home.
Original Mortgage
$142,709
Interest Rate
5.78%
Mortgage Type
FHA
Purchase Details
Closed on
May 12, 2004
Sold by
Fieldstone Associates Lp
Bought by
Brookwood Home Builders Inc
Create a Home Valuation Report for This Property
The Home Valuation Report is an in-depth analysis detailing your home's value as well as a comparison with similar homes in the area
Home Values in the Area
Average Home Value in this Area
Purchase History
| Date | Buyer | Sale Price | Title Company |
|---|---|---|---|
| Mcqueen Denish L | $168,000 | Integrated Title Services Ll | |
| Fryar Kerel J | $145,000 | -- | |
| Brookwood Home Builders Inc | $81,000 | -- |
Source: Public Records
Mortgage History
| Date | Status | Borrower | Loan Amount |
|---|---|---|---|
| Open | Mcqueen Denish L | $164,957 | |
| Previous Owner | Fryar Kerel J | $142,709 |
Source: Public Records
Tax History Compared to Growth
Tax History
| Year | Tax Paid | Tax Assessment Tax Assessment Total Assessment is a certain percentage of the fair market value that is determined by local assessors to be the total taxable value of land and additions on the property. | Land | Improvement |
|---|---|---|---|---|
| 2025 | $2,696 | $335,800 | $85,000 | $250,800 |
| 2024 | $2,696 | $335,800 | $85,000 | $250,800 |
| 2023 | $2,602 | $335,800 | $85,000 | $250,800 |
| 2022 | $2,095 | $204,100 | $30,000 | $174,100 |
| 2021 | $2,084 | $204,100 | $30,000 | $174,100 |
| 2020 | $2,077 | $204,100 | $30,000 | $174,100 |
| 2019 | $2,061 | $204,100 | $30,000 | $174,100 |
| 2018 | $1,884 | $138,000 | $19,800 | $118,200 |
| 2017 | $1,849 | $138,000 | $19,800 | $118,200 |
| 2016 | $1,840 | $138,000 | $19,800 | $118,200 |
| 2015 | $1,828 | $138,000 | $19,800 | $118,200 |
| 2014 | $1,834 | $138,000 | $19,800 | $118,200 |
Source: Public Records
Map
Nearby Homes
- 11039 Palestrina Rd
- 9339 Bradstreet Commons Way Unit 25
- 9036 Bradstreet Commons Way
- 9388 Hamel St
- 8953 Bradstreet Commons Way
- 11121 Nolet Ct
- 8502 Mansell Ct
- 9843 Drawbridge Dr
- 9922 Drawbridge Dr
- 8112 Cambridge Commons Dr
- 1036 BraMcOte Ln
- 8239 Weeping Fig Ln
- 8257 Weeping Fig Ln
- 7016 Branch Fork Rd
- 8904 Daventry Place
- 5220 Belstone Ln
- 11001 Dulin Creek Blvd
- 4037 Stoneygreen Ln
- 11404 Magpie Ct Unit 11
- 7525 Hammond Dr
- 9612 Bradstreet Commons Way
- 9606 Bradstreet Commons Way
- 9535 Currier Rd
- 9531 Currier Rd
- 7712 Deluca Dr
- 7708 Deluca Dr
- 9613 Bradstreet Commons Way Unit 3
- 9613 Bradstreet Commons Way
- 9617 Bradstreet Commons Way
- 7704 Deluca Dr
- 9609 Bradstreet Commons Way
- 9527 Currier Rd
- 9605 Bradstreet Commons Way
- 7700 Deluca Dr
- 9523 Currier Rd
- 9542 Bradstreet Commons Way
- 9625 Bradstreet Commons Way
- 9601 Bradstreet Commons Way
- 7640 Deluca Dr
- 9519 Currier Rd