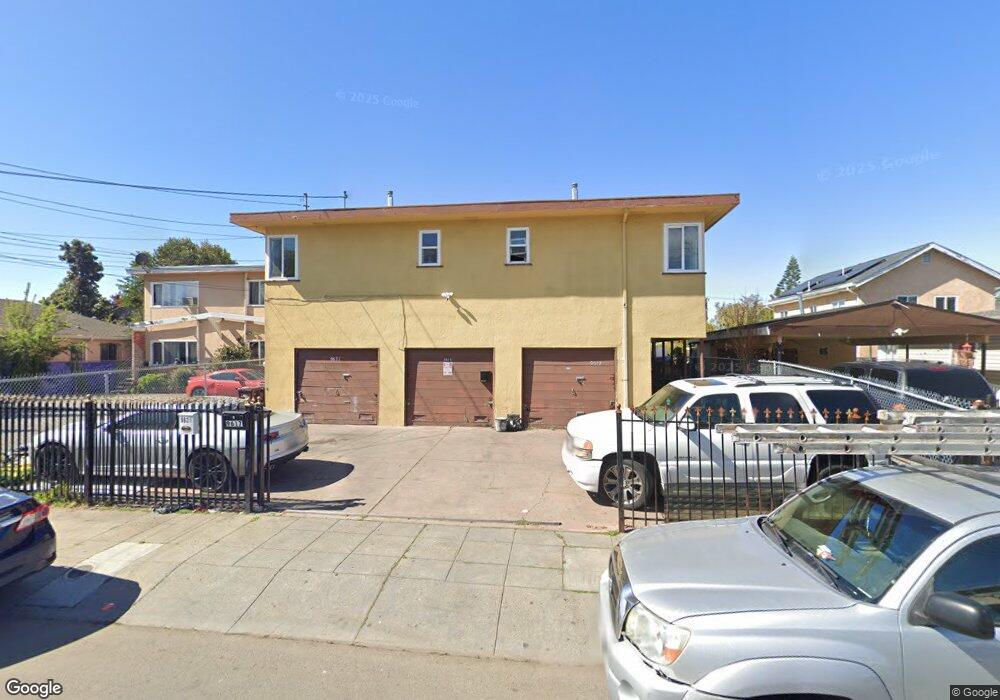
9617 C St Oakland, CA 94603
Elmhurst Park NeighborhoodEstimated Value: $518,797 - $760,000
4
Beds
3
Baths
1,988
Sq Ft
$326/Sq Ft
Est. Value
About This Home
This home is located at 9617 C St, Oakland, CA 94603 and is currently estimated at $647,699, approximately $325 per square foot. 9617 C St is a home located in Alameda County with nearby schools including Fred T. Korematsu Discovery Academy, Esperanza Elementary School, and Elmhurst United Middle School.
Ownership History
Date
Name
Owned For
Owner Type
Purchase Details
Closed on
Jun 10, 2011
Sold by
Wu Wenlin and Dong Guohong
Bought by
Wu Wenlin and Dong Guohong
Current Estimated Value
Home Financials for this Owner
Home Financials are based on the most recent Mortgage that was taken out on this home.
Original Mortgage
$135,750
Outstanding Balance
$93,787
Interest Rate
4.83%
Mortgage Type
New Conventional
Estimated Equity
$553,912
Purchase Details
Closed on
Apr 11, 2011
Sold by
Byal Clarence C and Byal Catherine A
Bought by
Wu Wenlin and Dong Guohong
Home Financials for this Owner
Home Financials are based on the most recent Mortgage that was taken out on this home.
Original Mortgage
$135,750
Outstanding Balance
$93,787
Interest Rate
4.83%
Mortgage Type
New Conventional
Estimated Equity
$553,912
Purchase Details
Closed on
Apr 29, 2009
Sold by
Deutsche Bank National Trust Company
Bought by
Byal Clarence C and Byal Catherine A
Home Financials for this Owner
Home Financials are based on the most recent Mortgage that was taken out on this home.
Original Mortgage
$81,900
Interest Rate
7.62%
Mortgage Type
Purchase Money Mortgage
Purchase Details
Closed on
Jun 13, 2008
Sold by
Tobar David
Bought by
Deutsche Bank National Trust Co and Long Beach Mortgage Loan Trust 2006-1
Purchase Details
Closed on
May 17, 2007
Sold by
Tobar David
Bought by
Tobar David and Wolanska Zaneta
Purchase Details
Closed on
Dec 15, 2005
Sold by
Tobar Maritza Rubidia
Bought by
Tobar David
Home Financials for this Owner
Home Financials are based on the most recent Mortgage that was taken out on this home.
Original Mortgage
$464,100
Interest Rate
10.8%
Mortgage Type
Purchase Money Mortgage
Purchase Details
Closed on
Dec 5, 2005
Sold by
Rachal Allen J and Rachal Velma L
Bought by
Tobar David
Home Financials for this Owner
Home Financials are based on the most recent Mortgage that was taken out on this home.
Original Mortgage
$464,100
Interest Rate
10.8%
Mortgage Type
Purchase Money Mortgage
Purchase Details
Closed on
Mar 18, 2004
Sold by
Rachal Velma L and Rachal Andre
Bought by
Rachal Allen J and Rachal Velma L
Create a Home Valuation Report for This Property
The Home Valuation Report is an in-depth analysis detailing your home's value as well as a comparison with similar homes in the area
Home Values in the Area
Average Home Value in this Area
Purchase History
| Date | Buyer | Sale Price | Title Company |
|---|---|---|---|
| Wu Wenlin | $10,000 | None Available | |
| Wu Wenlin | $181,000 | First American Title Company | |
| Byal Clarence C | $136,000 | Chicago Title Company | |
| Deutsche Bank National Trust Co | $202,500 | Servicelink | |
| Tobar David | -- | None Available | |
| Tobar David | -- | First American Title Company | |
| Tobar David | $546,000 | First American Title Company | |
| Rachal Allen J | -- | -- |
Source: Public Records
Mortgage History
| Date | Status | Borrower | Loan Amount |
|---|---|---|---|
| Open | Wu Wenlin | $135,750 | |
| Previous Owner | Byal Clarence C | $81,900 | |
| Previous Owner | Tobar David | $464,100 |
Source: Public Records
Tax History
| Year | Tax Paid | Tax Assessment Tax Assessment Total Assessment is a certain percentage of the fair market value that is determined by local assessors to be the total taxable value of land and additions on the property. | Land | Improvement |
|---|---|---|---|---|
| 2025 | $5,964 | $231,878 | $69,563 | $162,315 |
| 2024 | $5,964 | $227,333 | $68,200 | $159,133 |
| 2023 | $6,060 | $222,877 | $66,863 | $156,014 |
| 2022 | $5,689 | $218,508 | $65,552 | $152,956 |
| 2021 | $5,112 | $214,224 | $64,267 | $149,957 |
| 2020 | $5,048 | $212,028 | $63,608 | $148,420 |
| 2019 | $4,647 | $207,872 | $62,361 | $145,511 |
| 2018 | $4,552 | $203,798 | $61,139 | $142,659 |
| 2017 | $4,287 | $199,803 | $59,941 | $139,862 |
| 2016 | $4,085 | $195,887 | $58,766 | $137,121 |
| 2015 | $4,058 | $192,945 | $57,883 | $135,062 |
| 2014 | $4,192 | $189,166 | $56,750 | $132,416 |
Source: Public Records
Map
Nearby Homes
- 9624 E St
- 9430 C St
- 1211 96th Ave
- 9419 B St
- 1260 96th Ave
- 9820 B St
- 9821 E St
- 9847 A St
- 9625 Armstrong Dr
- 9639 International Blvd
- 9337 International Blvd
- 9251 International Blvd
- 1302 91st Ave
- 7 Town Square Place
- 947 91st Ave
- 9939 International Blvd
- 9028 A St
- 9920 International Blvd
- 10200 Royal Ann St
- 9996 International Blvd
Your Personal Tour Guide
Ask me questions while you tour the home.