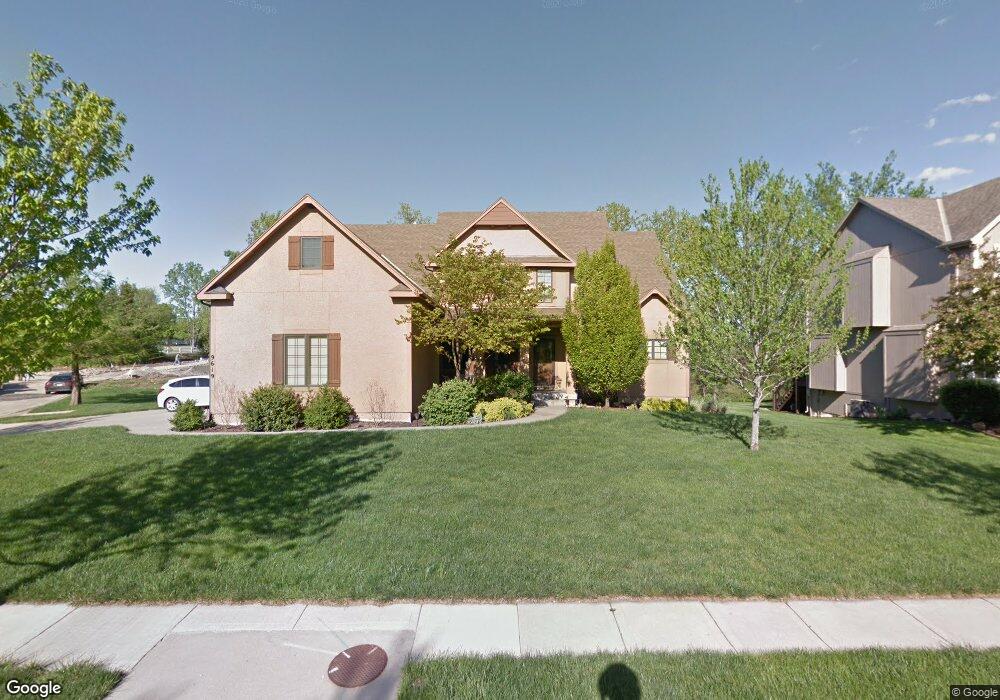
9619 Falcon Valley Dr Lenexa, KS 66220
Estimated Value: $565,000 - $645,000
5
Beds
6
Baths
2,547
Sq Ft
$237/Sq Ft
Est. Value
About This Home
This home is located at 9619 Falcon Valley Dr, Lenexa, KS 66220 and is currently estimated at $603,279, approximately $236 per square foot. 9619 Falcon Valley Dr is a home located in Johnson County with nearby schools including Manchester Park Elementary School, Prairie Trail Middle School, and Olathe Northwest High School.
Ownership History
Date
Name
Owned For
Owner Type
Purchase Details
Closed on
Feb 13, 2013
Sold by
Biggs Louis E and Biggs Virginia E
Bought by
Biggs Louis E and Biggs Virginia E
Current Estimated Value
Purchase Details
Closed on
Feb 18, 2005
Sold by
Shelman Jill D and Frederes Joseph J
Bought by
Biggs Louis E and Biggs Virginia E
Home Financials for this Owner
Home Financials are based on the most recent Mortgage that was taken out on this home.
Original Mortgage
$235,000
Interest Rate
5.5%
Mortgage Type
Adjustable Rate Mortgage/ARM
Purchase Details
Closed on
Jun 1, 2004
Sold by
Falcon Valley Llc
Bought by
Shelman Jill D
Home Financials for this Owner
Home Financials are based on the most recent Mortgage that was taken out on this home.
Original Mortgage
$230,300
Interest Rate
6.26%
Mortgage Type
Construction
Create a Home Valuation Report for This Property
The Home Valuation Report is an in-depth analysis detailing your home's value as well as a comparison with similar homes in the area
Home Values in the Area
Average Home Value in this Area
Purchase History
| Date | Buyer | Sale Price | Title Company |
|---|---|---|---|
| Biggs Louis E | -- | None Available | |
| Biggs Louis E | -- | Security Land Title Co | |
| Shelman Jill D | -- | Security Land Title Company |
Source: Public Records
Mortgage History
| Date | Status | Borrower | Loan Amount |
|---|---|---|---|
| Previous Owner | Biggs Louis E | $235,000 | |
| Previous Owner | Shelman Jill D | $230,300 |
Source: Public Records
Tax History Compared to Growth
Tax History
| Year | Tax Paid | Tax Assessment Tax Assessment Total Assessment is a certain percentage of the fair market value that is determined by local assessors to be the total taxable value of land and additions on the property. | Land | Improvement |
|---|---|---|---|---|
| 2024 | $7,321 | $59,570 | $9,952 | $49,618 |
| 2023 | $7,109 | $56,787 | $9,952 | $46,835 |
| 2022 | $6,872 | $53,532 | $8,658 | $44,874 |
| 2021 | $6,744 | $50,002 | $7,868 | $42,134 |
| 2020 | $6,586 | $48,357 | $7,868 | $40,489 |
| 2019 | $6,883 | $50,186 | $6,562 | $43,624 |
| 2018 | $6,969 | $50,267 | $7,749 | $42,518 |
| 2017 | $7,012 | $49,496 | $7,749 | $41,747 |
| 2016 | $6,615 | $47,748 | $7,749 | $39,999 |
| 2015 | $6,492 | $46,874 | $7,750 | $39,124 |
| 2013 | -- | $41,676 | $7,750 | $33,926 |
Source: Public Records
Map
Nearby Homes
- 0 W 95th St
- 9835 Walker St
- 9844 Stevenson St
- 18932 W 100th St
- 18804 W 99th St
- 9517 Falcon Ridge Dr
- 18637 W 97th Terrace
- 18732 W 99th St
- 9917 Fountain Cir
- 20516 W 98th Place
- 20308 W 92nd St
- 9705 Sunset Cir
- 20825 W 94th Terrace
- 20914 W 96th Terrace
- 22003 W 100th Terrace
- 21111 W 95th Terrace
- 19430 W 87th Ln
- 21123 W 95th Terrace
- 20802 W 102nd St
- 8823 Vista Dr
- 9623 Falcon Valley Dr
- 9618 Falcon Valley Dr
- 19500 W 96th Terrace
- 9627 Falcon Valley Dr
- 9622 Falcon Valley Dr
- 19351 W 96th St
- 19505 W 96th Terrace
- 9626 Falcon Valley Dr
- 19508 W 96th Terrace
- 9701 Falcon Valley St
- 19512 W 97th St
- 19511 W 96th Terrace
- 19514 W 96th Terrace
- 19518 W 97th St
- 19601 W 96th Terrace
- 19501 W 97th St
- 19507 W 97th St
- 19602 W 96th Terrace
- 19511 W 97th St
- 19524 W 97th St