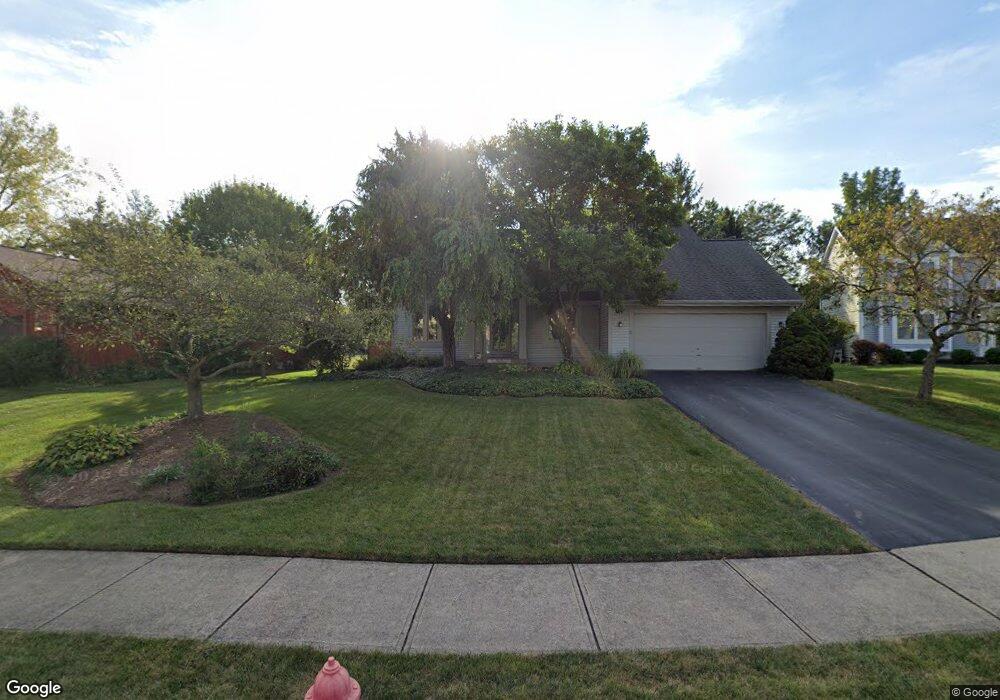
962 Dark Shadow Ct Westerville, OH 43081
Estimated Value: $392,867 - $473,000
4
Beds
3
Baths
1,988
Sq Ft
$219/Sq Ft
Est. Value
About This Home
This home is located at 962 Dark Shadow Ct, Westerville, OH 43081 and is currently estimated at $435,967, approximately $219 per square foot. 962 Dark Shadow Ct is a home located in Franklin County with nearby schools including Mcvay Elementary School, Walnut Springs Middle School, and Westerville-North High School.
Ownership History
Date
Name
Owned For
Owner Type
Purchase Details
Closed on
Feb 8, 2005
Sold by
Raynack Michael S
Bought by
Raynack Molly S and Stark Molly A
Current Estimated Value
Home Financials for this Owner
Home Financials are based on the most recent Mortgage that was taken out on this home.
Original Mortgage
$153,800
Interest Rate
5.78%
Mortgage Type
New Conventional
Purchase Details
Closed on
Mar 21, 2001
Sold by
Farkas Joseph L and Farkas Camille A
Bought by
Raynack Michael S and Stark Molly A
Home Financials for this Owner
Home Financials are based on the most recent Mortgage that was taken out on this home.
Original Mortgage
$159,600
Interest Rate
7.13%
Purchase Details
Closed on
Apr 30, 1997
Sold by
Stair Stephen V and Stair Margaret D
Bought by
Farkas Joseph L and Farkas Camiller A
Home Financials for this Owner
Home Financials are based on the most recent Mortgage that was taken out on this home.
Original Mortgage
$154,850
Interest Rate
7.5%
Purchase Details
Closed on
Mar 14, 1994
Purchase Details
Closed on
Oct 1, 1986
Create a Home Valuation Report for This Property
The Home Valuation Report is an in-depth analysis detailing your home's value as well as a comparison with similar homes in the area
Home Values in the Area
Average Home Value in this Area
Purchase History
| Date | Buyer | Sale Price | Title Company |
|---|---|---|---|
| Raynack Molly S | -- | Tri Star | |
| Raynack Michael S | $168,000 | Title First Agency Inc | |
| Farkas Joseph L | $163,000 | Foundation Title Agency Inc | |
| -- | $154,900 | -- | |
| -- | $113,500 | -- |
Source: Public Records
Mortgage History
| Date | Status | Borrower | Loan Amount |
|---|---|---|---|
| Closed | Raynack Molly S | $153,800 | |
| Closed | Raynack Michael S | $159,600 | |
| Closed | Farkas Joseph L | $154,850 |
Source: Public Records
Tax History
| Year | Tax Paid | Tax Assessment Tax Assessment Total Assessment is a certain percentage of the fair market value that is determined by local assessors to be the total taxable value of land and additions on the property. | Land | Improvement |
|---|---|---|---|---|
| 2025 | $7,127 | $125,410 | $31,500 | $93,910 |
| 2024 | $7,127 | $125,410 | $31,500 | $93,910 |
| 2023 | $6,976 | $125,405 | $31,500 | $93,905 |
| 2022 | $6,079 | $83,440 | $21,000 | $62,440 |
| 2021 | $6,130 | $83,440 | $21,000 | $62,440 |
| 2020 | $6,113 | $83,440 | $21,000 | $62,440 |
| 2019 | $5,351 | $68,950 | $17,500 | $51,450 |
| 2018 | $5,449 | $68,950 | $17,500 | $51,450 |
| 2017 | $5,550 | $68,950 | $17,500 | $51,450 |
| 2016 | $5,837 | $69,620 | $15,510 | $54,110 |
| 2015 | $5,653 | $69,620 | $15,510 | $54,110 |
| 2014 | $5,657 | $69,620 | $15,510 | $54,110 |
| 2013 | $2,690 | $66,290 | $14,770 | $51,520 |
Source: Public Records
Map
Nearby Homes
- 974 Timberbank Dr
- 321 Northgate Ct Unit B
- 304 Crosswind Dr Unit A, B, C, D, E, F
- 868 Liverpool Place
- 689 Liberty Ln
- 281 Cross Country Dr S Unit C
- 277 Cross Country Dr S Unit A
- 636 E Schrock Rd
- 322 Huber Village Blvd
- 672 Liberty Ln
- 612 E Schrock Rd
- 45 Kanpur Place
- 852 Watten Ln
- 3678 Paris Blvd
- 270 Brisbane Ave
- 703 Pointview Dr
- 3627 Manila Dr
- 3661 Paris Blvd
- 392 Hickory Ln
- 6348 Showy Ct
- 956 Dark Shadow Ct
- 966 Dark Shadow Ct
- 617 Moonlight Ct
- 952 Dark Shadow Ct
- 622 Moonlight Ct
- 972 Dark Shadow Ct
- 623 Moonlight Ct
- 959 Dark Shadow Ct
- 963 Dark Shadow Ct
- 955 Dark Shadow Ct
- 967 Dark Shadow Ct
- 628 Moonlight Ct
- 948 Dark Shadow Ct
- 973 Dark Shadow Ct
- 627 Moonlight Ct
- 609 Colony Dr
- 634 Moonlight Ct
- 619 Colony Dr
- 633 Moonlight Ct
- 627 Colony Dr
Your Personal Tour Guide
Ask me questions while you tour the home.