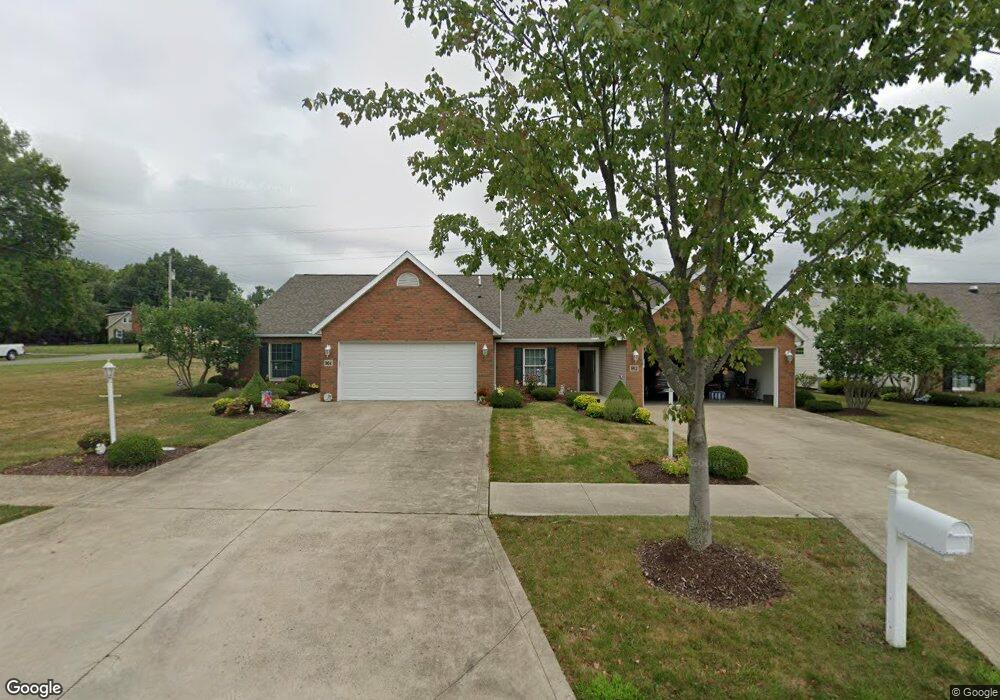
962 Oakbrook Dr Ashland, OH 44805
Estimated Value: $132,013 - $303,000
2
Beds
2
Baths
1,720
Sq Ft
$145/Sq Ft
Est. Value
About This Home
This home is located at 962 Oakbrook Dr, Ashland, OH 44805 and is currently estimated at $250,003, approximately $145 per square foot. 962 Oakbrook Dr is a home located in Ashland County with nearby schools including Ashland High School, Ashland County Community Academy, and St. Edward Elementary School.
Ownership History
Date
Name
Owned For
Owner Type
Purchase Details
Closed on
Sep 12, 2025
Sold by
Yocum Lisa
Bought by
Galazka Christine M
Current Estimated Value
Purchase Details
Closed on
Sep 10, 2025
Sold by
Lent Janet
Bought by
Galazka Christine M
Purchase Details
Closed on
Apr 29, 2016
Sold by
Hickey Family Trust
Bought by
Robinson Carol
Purchase Details
Closed on
Jan 14, 2011
Sold by
Humrichouser Steven R
Purchase Details
Closed on
Mar 5, 2010
Sold by
Humrichouser Virginia
Bought by
Humrichouser Steven R
Purchase Details
Closed on
Apr 23, 2008
Sold by
Humrichouser Virginia
Bought by
Humrichouser Virginia
Purchase Details
Closed on
Oct 28, 2005
Sold by
Williams Clayton W
Bought by
Humrichouser Virginia
Purchase Details
Closed on
May 7, 2003
Bought by
Williams Clayton W
Purchase Details
Closed on
May 7, 2001
Create a Home Valuation Report for This Property
The Home Valuation Report is an in-depth analysis detailing your home's value as well as a comparison with similar homes in the area
Home Values in the Area
Average Home Value in this Area
Purchase History
| Date | Buyer | Sale Price | Title Company |
|---|---|---|---|
| Galazka Christine M | $132,500 | Castle Real Estate Title | |
| Galazka Christine M | $132,500 | Castle Real Estate Title | |
| Robinson Carol | $151,000 | Ashland Title | |
| -- | $135,000 | -- | |
| Humrichouser Steven R | -- | -- | |
| Humrichouser Virginia | -- | -- | |
| Humrichouser Virginia | $157,900 | -- | |
| Williams Clayton W | $141,900 | -- | |
| -- | -- | -- |
Source: Public Records
Tax History
| Year | Tax Paid | Tax Assessment Tax Assessment Total Assessment is a certain percentage of the fair market value that is determined by local assessors to be the total taxable value of land and additions on the property. | Land | Improvement |
|---|---|---|---|---|
| 2025 | $2,434 | $75,390 | $10,400 | $64,990 |
| 2024 | $1,132 | $75,390 | $10,400 | $64,990 |
| 2023 | $2,264 | $75,390 | $10,400 | $64,990 |
| 2022 | $2,047 | $55,840 | $7,700 | $48,140 |
| 2021 | $2,061 | $55,840 | $7,700 | $48,140 |
| 2020 | $1,945 | $55,840 | $7,700 | $48,140 |
| 2019 | $1,778 | $48,460 | $7,840 | $40,620 |
| 2018 | $1,799 | $48,460 | $7,840 | $40,620 |
| 2017 | $2,196 | $48,460 | $7,840 | $40,620 |
| 2016 | $2,048 | $43,270 | $7,000 | $36,270 |
| 2015 | $2,030 | $43,270 | $7,000 | $36,270 |
| 2013 | $2,250 | $47,280 | $4,990 | $42,290 |
Source: Public Records
Map
Nearby Homes
- 870 King Ridge Dr
- 908 King Ridge Dr
- 832 Avalon Dr
- 0 Claremont Ave
- 1937 Claremont Ave
- 977-B Township Road 1514
- 711 Grant St
- 224 Sharon Ave
- 703 Grant St
- 162 Arthur's Ct
- 120 High St
- 1551 Township Road 1153
- 219 W Washington St
- 427 W Main St
- 102 E Liberty St
- 515 Sandusky St
- 934 Summit Dr
- 416-418 Carroll St
- 304 Prospect St
- 1114 Surrey Cir
- 917 Oakbrook Dr
- 915 Oakbrook Dr
- 924 Oakbrook Dr
- 926 Oakbrook Dr
- 930 Oakbrook Dr
- 932 Oakbrook Dr
- 940 Oakbrook Dr
- 942 Oakbrook Dr
- 944 Oakbrook Dr
- 950 Oakbrook Dr
- 952 Oakbrook Dr
- 954 Oakbrook Dr
- 964 Oakbrook Dr
- 945 Oakbrook Dr
- 949 Oakbrook Dr
- 947 Oakbrook Dr
- 919 Oakbrook Dr
- 0 Columbus Cir N
- 909 Oakbrook Dr
- 907 Oakbrook Dr
Your Personal Tour Guide
Ask me questions while you tour the home.