962 Peacock St Hammond, OR 97121
Estimated Value: $444,000 - $473,000
3
Beds
3
Baths
1,625
Sq Ft
$283/Sq Ft
Est. Value
About This Home
This home is located at 962 Peacock St, Hammond, OR 97121 and is currently estimated at $460,194, approximately $283 per square foot. 962 Peacock St is a home located in Clatsop County with nearby schools including Warrenton Grade School, Warrenton High School, and Anchor Christian Academy.
Ownership History
Date
Name
Owned For
Owner Type
Purchase Details
Closed on
Mar 29, 2017
Sold by
Fannie Mae
Bought by
Hardesty Katie
Current Estimated Value
Home Financials for this Owner
Home Financials are based on the most recent Mortgage that was taken out on this home.
Original Mortgage
$227,272
Outstanding Balance
$187,908
Interest Rate
4.15%
Mortgage Type
New Conventional
Estimated Equity
$272,286
Purchase Details
Closed on
Sep 10, 2015
Sold by
Davis Jason L and Mcmasters Elena J
Bought by
Federal National Mortgage Association
Purchase Details
Closed on
May 5, 2015
Sold by
Flagstar Bank Fsb
Bought by
Federal National Mortgage Association
Purchase Details
Closed on
Oct 10, 2008
Sold by
Derickson Scott and Derickson Kathy
Bought by
Davis Jason L and Mcmasters Elena J
Home Financials for this Owner
Home Financials are based on the most recent Mortgage that was taken out on this home.
Original Mortgage
$207,950
Interest Rate
6.31%
Mortgage Type
Purchase Money Mortgage
Create a Home Valuation Report for This Property
The Home Valuation Report is an in-depth analysis detailing your home's value as well as a comparison with similar homes in the area
Purchase History
| Date | Buyer | Sale Price | Title Company |
|---|---|---|---|
| Hardesty Katie | $225,000 | Ticor Title Ins Co | |
| Federal National Mortgage Association | $247,911 | None Available | |
| Federal National Mortgage Association | -- | Pacific Title Company | |
| Davis Jason L | $259,950 | Ticor Title Ins Co |
Source: Public Records
Mortgage History
| Date | Status | Borrower | Loan Amount |
|---|---|---|---|
| Open | Hardesty Katie | $227,272 | |
| Previous Owner | Davis Jason L | $207,950 |
Source: Public Records
Tax History
| Year | Tax Paid | Tax Assessment Tax Assessment Total Assessment is a certain percentage of the fair market value that is determined by local assessors to be the total taxable value of land and additions on the property. | Land | Improvement |
|---|---|---|---|---|
| 2025 | $3,336 | $250,700 | -- | -- |
| 2024 | $3,238 | $243,399 | -- | -- |
| 2023 | $3,132 | $236,311 | $0 | $0 |
| 2022 | $3,079 | $229,429 | $0 | $0 |
| 2021 | $3,033 | $222,748 | $0 | $0 |
| 2020 | $2,962 | $216,261 | $0 | $0 |
| 2019 | $2,887 | $209,964 | $0 | $0 |
Source: Public Records
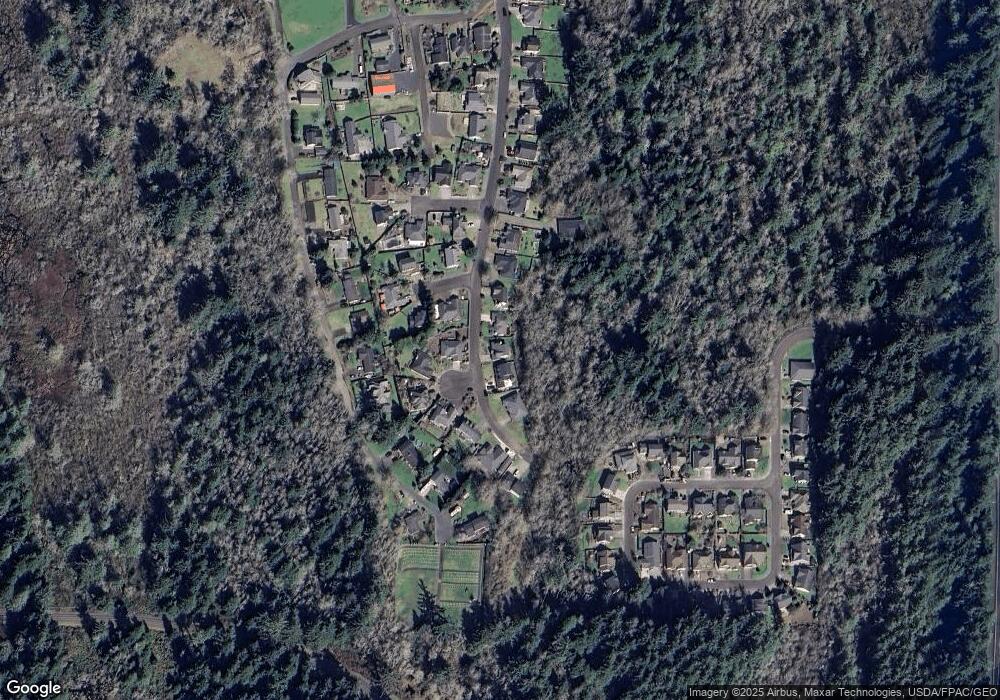
Map
Nearby Homes
- 1050 Peacock St
- 1009 King Salmon Place
- 946 King Salmon Place
- 1175 Pacific Dr
- 1880 1st Ave
- 590 7th Ave
- 448 Pacific Dr
- 0 NW Warrenton Dr Unit 185045184
- 676 NW 9th St
- 701 NW Warrenton Dr #28
- 701 NW Warrenton Dr Unit 13
- 701 NW Warrenton Dr
- 701 NW Warrenton Dr Unit 28
- 101 SW Juniper Ave
- 15 NW 6th Place
- 1015 SW 2nd St
- 47 SW Gardenia Ave
- 0 NW Date Ave
- 332 SW Kalmia Ave
- 0 NW Cedar Ave
- 994 Peacock St
- 926 Peacock St
- 892 Peacock St
- 965 Peacock St
- 1532 8th Ct
- 876 Peacock St
- 1075 Peacock St
- 1045 Peacock St
- 985 Peacock St
- 1025 Peacock Ave
- 1025 Peacock St
- 856 Peacock St
- 1640 8th Ct
- 855 Peacock St
- 1105 Peacock St
- 846 Peacock St
- 845 Peacock 1weuouonnrwx
- 845 Peacock St
- 1639 8th Ct
- 1115 Peacock St
Your Personal Tour Guide
Ask me questions while you tour the home.