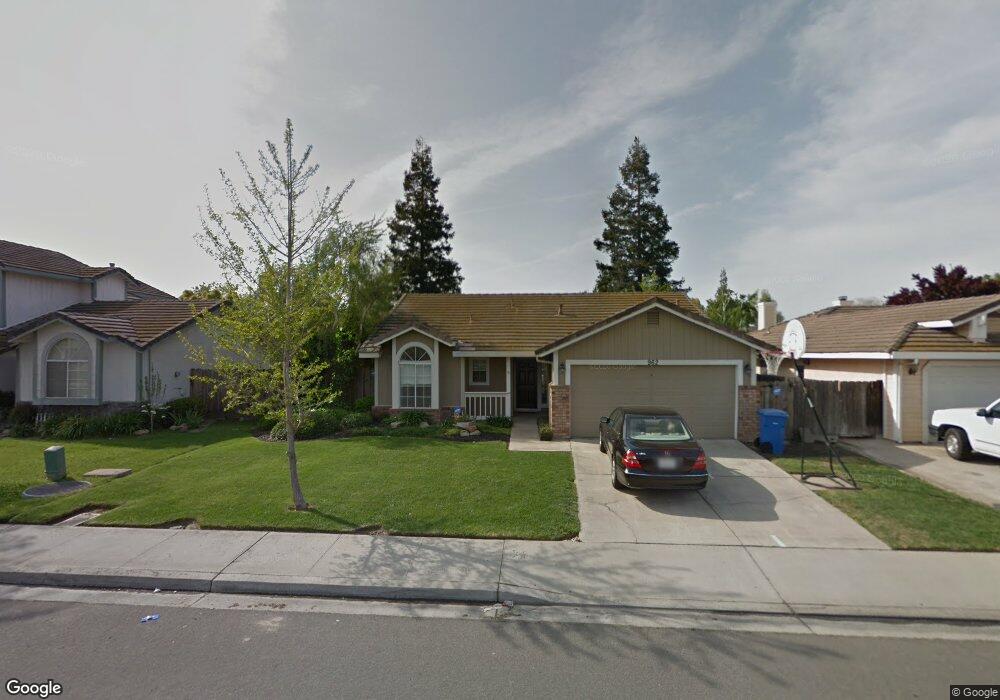
962 W Springer Dr Turlock, CA 95382
Estimated Value: $443,452 - $488,000
3
Beds
2
Baths
1,354
Sq Ft
$345/Sq Ft
Est. Value
About This Home
This home is located at 962 W Springer Dr, Turlock, CA 95382 and is currently estimated at $467,613, approximately $345 per square foot. 962 W Springer Dr is a home located in Stanislaus County with nearby schools including Sandra Tovar Medeiros Elementary School, Turlock Junior High School, and Marvin A. Dutcher Middle School.
Ownership History
Date
Name
Owned For
Owner Type
Purchase Details
Closed on
Apr 6, 2020
Sold by
Magnu Joseph L and Magnu Christine
Bought by
Magnu Joseph L and Magnu Christine L
Current Estimated Value
Purchase Details
Closed on
Apr 4, 2003
Sold by
Magnu Joseph L
Bought by
Magnu Joseph L and Magnu Christine
Home Financials for this Owner
Home Financials are based on the most recent Mortgage that was taken out on this home.
Original Mortgage
$108,650
Outstanding Balance
$46,197
Interest Rate
5.73%
Estimated Equity
$421,416
Purchase Details
Closed on
Feb 8, 1994
Sold by
Coleman Marc Dewey and Coleman Veronica M
Bought by
Magnu Joseph L
Home Financials for this Owner
Home Financials are based on the most recent Mortgage that was taken out on this home.
Original Mortgage
$115,952
Interest Rate
6.98%
Mortgage Type
FHA
Create a Home Valuation Report for This Property
The Home Valuation Report is an in-depth analysis detailing your home's value as well as a comparison with similar homes in the area
Purchase History
| Date | Buyer | Sale Price | Title Company |
|---|---|---|---|
| Magnu Joseph L | -- | None Available | |
| Magnu Joseph L | -- | Alliance Title Company | |
| Magnu Joseph L | $116,500 | Chicago Title Company |
Source: Public Records
Mortgage History
| Date | Status | Borrower | Loan Amount |
|---|---|---|---|
| Open | Magnu Joseph L | $108,650 | |
| Closed | Magnu Joseph L | $115,952 |
Source: Public Records
Tax History
| Year | Tax Paid | Tax Assessment Tax Assessment Total Assessment is a certain percentage of the fair market value that is determined by local assessors to be the total taxable value of land and additions on the property. | Land | Improvement |
|---|---|---|---|---|
| 2025 | $2,051 | $197,991 | $67,975 | $130,016 |
| 2024 | $2,012 | $194,110 | $66,643 | $127,467 |
| 2023 | $2,007 | $190,305 | $65,337 | $124,968 |
| 2022 | $1,980 | $186,574 | $64,056 | $122,518 |
| 2021 | $1,950 | $182,916 | $62,800 | $120,116 |
| 2020 | $1,935 | $181,042 | $62,157 | $118,885 |
| 2019 | $1,902 | $177,493 | $60,939 | $116,554 |
| 2018 | $1,898 | $174,014 | $59,745 | $114,269 |
| 2017 | $1,853 | $170,603 | $58,574 | $112,029 |
| 2016 | $1,729 | $167,259 | $57,426 | $109,833 |
| 2015 | $1,713 | $164,748 | $56,564 | $108,184 |
| 2014 | $1,694 | $161,521 | $55,456 | $106,065 |
Source: Public Records
Map
Nearby Homes
- 4184 Horizon Ct
- 1232 Paseo Belleza
- 4246 Merchant Ln
- 1360 Shady Ln Unit 923
- 1360 Shady Ln Unit 1022
- 4185 Pathway Ln
- 4666 Treasure Ct
- 1894 Greenfield Dr
- 1901 Geer Rd
- 2394 Tea Rose St
- 5201 N Tully Rd
- 225 Fullerton Dr
- 4213 Montara Dr
- 4500 Fosberg Rd
- 3178 Andre Ln
- 3350 Spring Garden Dr
- 805 Cole Ave
- 5333 Geer Rd
- 2905 Niagra St Unit 257
- 2061 Zane Way
- 942 W Springer Dr
- 982 W Springer Dr
- 4245 Piro Ct
- 4266 Piro Ct
- 922 W Springer Dr
- 1002 W Springer Dr
- 4244 Horizon Ct
- 1022 W Springer Dr
- 902 W Springer Dr
- 1005 W Springer Dr
- 4264 Horizon Ct
- 4246 Piro Ct
- 4225 Piro Ct
- 1025 W Springer Dr
- 4224 Horizon Ct
- 985 W Springer Dr
- 1042 W Springer Dr
- 1045 W Springer Dr
- 4226 Piro Ct
- 975 W Springer Dr
Your Personal Tour Guide
Ask me questions while you tour the home.