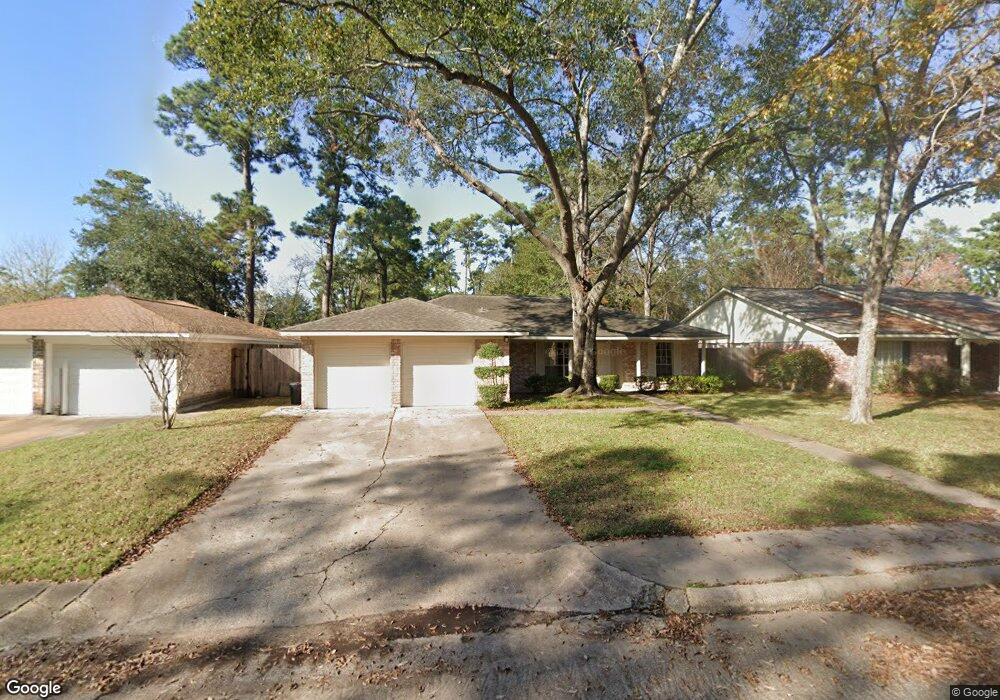
9622 Rannock Way Spring, TX 77379
Estimated Value: $236,662 - $249,000
3
Beds
2
Baths
1,624
Sq Ft
$150/Sq Ft
Est. Value
About This Home
This home is located at 9622 Rannock Way, Spring, TX 77379 and is currently estimated at $244,166, approximately $150 per square foot. 9622 Rannock Way is a home located in Harris County with nearby schools including Krahn Elementary School, Doerre Intermediate School, and Klein Cain High School.
Ownership History
Date
Name
Owned For
Owner Type
Purchase Details
Closed on
Nov 30, 2009
Sold by
Fannie Mae
Bought by
Montantes Linda
Current Estimated Value
Home Financials for this Owner
Home Financials are based on the most recent Mortgage that was taken out on this home.
Original Mortgage
$90,824
Outstanding Balance
$59,514
Interest Rate
4.99%
Mortgage Type
FHA
Estimated Equity
$184,652
Purchase Details
Closed on
Aug 10, 2009
Sold by
Emc Mortgage Corporation
Bought by
Federal National Mortgage Association
Purchase Details
Closed on
Aug 4, 2009
Sold by
Kane Timothy
Bought by
Emc Mortgage Corporation
Purchase Details
Closed on
Sep 21, 2006
Sold by
Davis Mable J
Bought by
Kane Timothy William
Home Financials for this Owner
Home Financials are based on the most recent Mortgage that was taken out on this home.
Original Mortgage
$15,750
Interest Rate
6.55%
Mortgage Type
Stand Alone Second
Create a Home Valuation Report for This Property
The Home Valuation Report is an in-depth analysis detailing your home's value as well as a comparison with similar homes in the area
Home Values in the Area
Average Home Value in this Area
Purchase History
| Date | Buyer | Sale Price | Title Company |
|---|---|---|---|
| Montantes Linda | -- | Etc | |
| Federal National Mortgage Association | -- | None Available | |
| Emc Mortgage Corporation | $90,376 | None Available | |
| Kane Timothy William | -- | Chicago Title Insurance Co |
Source: Public Records
Mortgage History
| Date | Status | Borrower | Loan Amount |
|---|---|---|---|
| Open | Montantes Linda | $90,824 | |
| Previous Owner | Kane Timothy William | $15,750 | |
| Previous Owner | Kane Timothy William | $84,000 |
Source: Public Records
Tax History Compared to Growth
Tax History
| Year | Tax Paid | Tax Assessment Tax Assessment Total Assessment is a certain percentage of the fair market value that is determined by local assessors to be the total taxable value of land and additions on the property. | Land | Improvement |
|---|---|---|---|---|
| 2025 | $776 | $219,337 | $56,844 | $162,493 |
| 2024 | $776 | $215,940 | $56,844 | $159,096 |
| 2023 | $776 | $188,000 | $56,844 | $131,156 |
| 2022 | $3,949 | $200,000 | $56,844 | $143,156 |
| 2021 | $3,830 | $153,420 | $25,747 | $127,673 |
| 2020 | $3,914 | $154,703 | $25,747 | $128,956 |
| 2019 | $3,721 | $135,887 | $25,747 | $110,140 |
| 2018 | $1,573 | $135,000 | $25,747 | $109,253 |
| 2017 | $3,430 | $145,034 | $25,747 | $119,287 |
| 2016 | $3,119 | $142,017 | $25,747 | $116,270 |
| 2015 | $2,266 | $136,288 | $25,747 | $110,541 |
| 2014 | $2,266 | $115,926 | $23,406 | $92,520 |
Source: Public Records
Map
Nearby Homes
- 9630 Landry Blvd
- 9715 Ballin David Dr
- 9519 Landry Blvd
- 9614 Ballin David Dr
- 9602 Ballin David Dr
- 17306 Chapel Pine St
- 16810 Methil Dr
- 17222 Modbury St
- 17226 Modbury St
- 17418 Largs Cir
- 9118 Colony Cove Dr
- 9130 Kirkleigh St
- 17426 Colony Creek Dr
- 17423 Victoria Lakes Cir
- 9115 Landry Blvd
- 17203 Kettle Creek Dr
- 9109 Benwick St
- 17327 Harmony Hill Dr
- 17326 Harmony Hill Dr
- 17311 Colony Creek Dr
- 9626 Rannock Way
- 9618 Rannock Way
- 9623 Landry Blvd
- 9630 Rannock Way
- 9614 Rannock Way
- 9627 Landry Blvd
- 9619 Landry Blvd
- 9631 Landry Blvd
- 9623 Rannock Way
- 9619 Rannock Way
- 9615 Landry Blvd
- 9627 Rannock Way
- 9610 Rannock Way
- 9634 Rannock Way
- 9635 Landry Blvd
- 9615 Rannock Way
- 9631 Rannock Way
- 9611 Landry Blvd
- 9606 Rannock Way
- 9611 Rannock Way