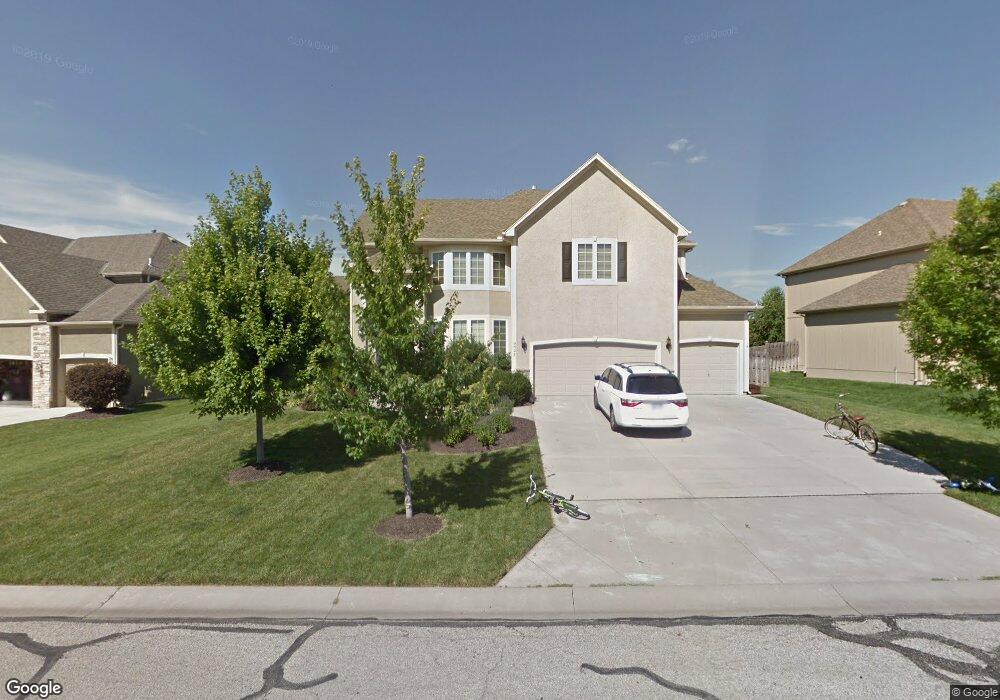
9625 Mccormack Dr Lenexa, KS 66227
Estimated Value: $616,628 - $774,000
4
Beds
4
Baths
2,906
Sq Ft
$244/Sq Ft
Est. Value
About This Home
This home is located at 9625 Mccormack Dr, Lenexa, KS 66227 and is currently estimated at $708,907, approximately $243 per square foot. 9625 Mccormack Dr is a home located in Johnson County with nearby schools including Canyon Creek Elementary School, Prairie Trail Middle School, and Olathe Northwest High School.
Ownership History
Date
Name
Owned For
Owner Type
Purchase Details
Closed on
Jun 8, 2007
Sold by
Hilmann Homes Inc
Bought by
Lemmon Daniel R and Lemmon Christine M
Current Estimated Value
Home Financials for this Owner
Home Financials are based on the most recent Mortgage that was taken out on this home.
Original Mortgage
$333,820
Outstanding Balance
$191,503
Interest Rate
5.5%
Mortgage Type
Adjustable Rate Mortgage/ARM
Estimated Equity
$517,404
Purchase Details
Closed on
Nov 16, 2005
Sold by
Patrician Village Llc
Bought by
Hilmann Homes Inc
Home Financials for this Owner
Home Financials are based on the most recent Mortgage that was taken out on this home.
Original Mortgage
$297,500
Interest Rate
5.92%
Mortgage Type
Future Advance Clause Open End Mortgage
Create a Home Valuation Report for This Property
The Home Valuation Report is an in-depth analysis detailing your home's value as well as a comparison with similar homes in the area
Home Values in the Area
Average Home Value in this Area
Purchase History
| Date | Buyer | Sale Price | Title Company |
|---|---|---|---|
| Lemmon Daniel R | -- | First American Title Ins Co | |
| Hilmann Homes Inc | -- | First American Title Ins Co |
Source: Public Records
Mortgage History
| Date | Status | Borrower | Loan Amount |
|---|---|---|---|
| Open | Lemmon Daniel R | $333,820 | |
| Previous Owner | Hilmann Homes Inc | $297,500 |
Source: Public Records
Tax History
| Year | Tax Paid | Tax Assessment Tax Assessment Total Assessment is a certain percentage of the fair market value that is determined by local assessors to be the total taxable value of land and additions on the property. | Land | Improvement |
|---|---|---|---|---|
| 2025 | $8,001 | $65,677 | $15,639 | $50,038 |
| 2024 | $8,001 | $65,056 | $14,219 | $50,837 |
| 2023 | $7,621 | $60,881 | $11,853 | $49,028 |
| 2022 | $7,343 | $56,201 | $10,771 | $45,430 |
| 2021 | $7,211 | $52,532 | $10,771 | $41,761 |
| 2020 | $6,899 | $49,715 | $10,771 | $38,944 |
| 2019 | $7,181 | $51,428 | $9,795 | $41,633 |
| 2018 | $6,776 | $47,921 | $9,795 | $38,126 |
| 2017 | $6,934 | $48,013 | $8,908 | $39,105 |
| 2016 | $6,552 | $46,311 | $8,094 | $38,217 |
| 2015 | $6,333 | $44,689 | $8,094 | $36,595 |
| 2013 | -- | $38,226 | $8,094 | $30,132 |
Source: Public Records
Map
Nearby Homes
- 9618 S Appleridge Ln
- 9896 Saddletop St
- 24948 W 98th Place
- 9310 Carbondale St
- 9702 Shady Bend Cir
- 24964 W 98th Place
- 24916 W 98th Place
- 24949 W 98th Place
- 24933 W 98th Place
- 24912 W 98th Place
- 24925 W 98th Place
- 24847 W 98th St
- 9318 Kenton St
- 22502 W 93rd Terrace
- 22504 W 93rd Terrace
- 24904 W 98th Place
- 24999 W 98th Place
- 23509 W 93rd St
- 9845 Shady Bend Rd
- 24950 W 94th Place
- 9631 Mccormack Dr
- Lot 67 Carbondale St
- Lot 68 Carbondale St
- 24127 W 95th Terrace
- 9643 Mccormack Dr
- 24123 W 95th Terrace
- 24123 W 95th St
- 24131 W 95th Terrace
- 9624 Mccormack Dr
- 9630 Mccormack Dr
- 9618 Mccormack Dr
- 24135 W 95th Terrace
- 9642 Mccormack Dr
- 9612 Mccormack Dr
- 9655 Mccormack Dr
- 24119 W 95th Terrace
- 9654 Mccormack Dr
- 9606 Mccormack Dr
- 9633 Appleridge Ln
- 9629 Appleridge Ln
Your Personal Tour Guide
Ask me questions while you tour the home.