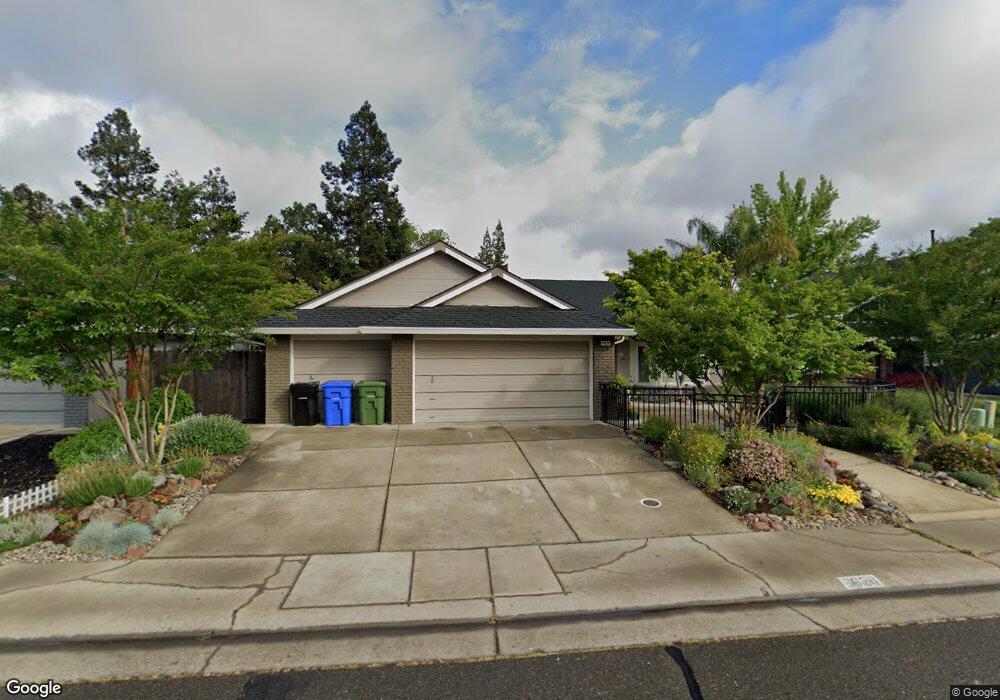
9626 Soaring Oaks Dr Elk Grove, CA 95758
North West Elk Grove NeighborhoodEstimated Value: $552,098 - $623,000
3
Beds
2
Baths
1,740
Sq Ft
$343/Sq Ft
Est. Value
About This Home
This home is located at 9626 Soaring Oaks Dr, Elk Grove, CA 95758 and is currently estimated at $596,275, approximately $342 per square foot. 9626 Soaring Oaks Dr is a home located in Sacramento County with nearby schools including Elitha Donner Elementary School, Harriet G. Eddy Middle School, and Laguna Creek High School.
Ownership History
Date
Name
Owned For
Owner Type
Purchase Details
Closed on
Sep 25, 2017
Sold by
Chapman Mark and Chapman Darcie
Bought by
Chapman Mark and Chapman Darcie
Current Estimated Value
Home Financials for this Owner
Home Financials are based on the most recent Mortgage that was taken out on this home.
Original Mortgage
$266,000
Outstanding Balance
$222,423
Interest Rate
3.86%
Mortgage Type
New Conventional
Estimated Equity
$373,852
Purchase Details
Closed on
Mar 25, 2013
Sold by
Chapman Mark A and Chapman Darcie
Bought by
Mark & Darcie Chapman Joint Living Trust
Purchase Details
Closed on
Sep 27, 2002
Sold by
Chapman Mark A and Chapman Darcie
Bought by
Chapman Mark A and Chapman Darcie
Home Financials for this Owner
Home Financials are based on the most recent Mortgage that was taken out on this home.
Original Mortgage
$180,000
Interest Rate
6.22%
Purchase Details
Closed on
Jan 7, 1999
Sold by
Beth Personius David L and Beth M
Bought by
Chapman Mark A and Chapman Darcia
Home Financials for this Owner
Home Financials are based on the most recent Mortgage that was taken out on this home.
Original Mortgage
$146,450
Interest Rate
6.66%
Create a Home Valuation Report for This Property
The Home Valuation Report is an in-depth analysis detailing your home's value as well as a comparison with similar homes in the area
Home Values in the Area
Average Home Value in this Area
Purchase History
| Date | Buyer | Sale Price | Title Company |
|---|---|---|---|
| Chapman Mark | -- | Stewart Title Company | |
| Mark & Darcie Chapman Joint Living Trust | -- | None Available | |
| Chapman Mark A | -- | Alliance Title Company | |
| Chapman Mark A | $151,000 | Chicago Title Co |
Source: Public Records
Mortgage History
| Date | Status | Borrower | Loan Amount |
|---|---|---|---|
| Open | Chapman Mark | $266,000 | |
| Closed | Chapman Mark A | $180,000 | |
| Closed | Chapman Mark A | $146,450 |
Source: Public Records
Tax History Compared to Growth
Tax History
| Year | Tax Paid | Tax Assessment Tax Assessment Total Assessment is a certain percentage of the fair market value that is determined by local assessors to be the total taxable value of land and additions on the property. | Land | Improvement |
|---|---|---|---|---|
| 2025 | $2,861 | $236,698 | $54,857 | $181,841 |
| 2024 | $2,861 | $232,058 | $53,782 | $178,276 |
| 2023 | $2,787 | $227,509 | $52,728 | $174,781 |
| 2022 | $2,727 | $223,049 | $51,695 | $171,354 |
| 2021 | $2,675 | $218,677 | $50,682 | $167,995 |
| 2020 | $2,637 | $216,436 | $50,163 | $166,273 |
| 2019 | $2,586 | $212,193 | $49,180 | $163,013 |
| 2018 | $2,517 | $208,033 | $48,216 | $159,817 |
| 2017 | $2,470 | $203,955 | $47,271 | $156,684 |
| 2016 | $2,353 | $199,957 | $46,345 | $153,612 |
| 2015 | $2,311 | $196,954 | $45,649 | $151,305 |
| 2014 | $2,274 | $193,097 | $44,755 | $148,342 |
Source: Public Records
Map
Nearby Homes
- 9508 Delburns Ct
- 9578 Dunkerrin Way
- 7300 Saltgrass Way
- 7109 Ballygar Way
- 7609 Dunblane Way
- 7801 Melfort Way
- 7120 Beaver Falls Way
- 7905 Baldur Ct
- 9560 Fox Flower Ct
- 9364 Ivydale Cir
- 9438 Dunkerrin Way
- 9510 Village Tree Dr
- 9550 Village Tree Dr
- 9357 Hoyleton Way
- 9333 Newington Way
- 8464 Crystal Walk Cir
- 9748 Collie Way
- 9672 Darley Way
- 6421 Noble House Ct
- 8397 Crystal Walk Cir
- 9622 Soaring Oaks Dr
- 9632 Soaring Oaks Dr
- 9511 Esmont Ct
- 9618 Soaring Oaks Dr
- 9638 Soaring Oaks Dr
- 9510 Esmont Ct
- 9507 Esmont Ct
- 9625 Soaring Oaks Dr
- 9631 Soaring Oaks Dr
- 9644 Soaring Oaks Dr
- 9619 Soaring Oaks Dr
- 9612 Soaring Oaks Dr
- 9614 Soaring Oaks Dr
- 9506 Esmont Ct
- 9506 Arborfield Dr
- 9519 Delburns Ct
- 9641 Soaring Oaks Dr
- 9501 Esmont Ct
- 9658 Soaring Oaks Dr
- 9613 Soaring Oaks Dr