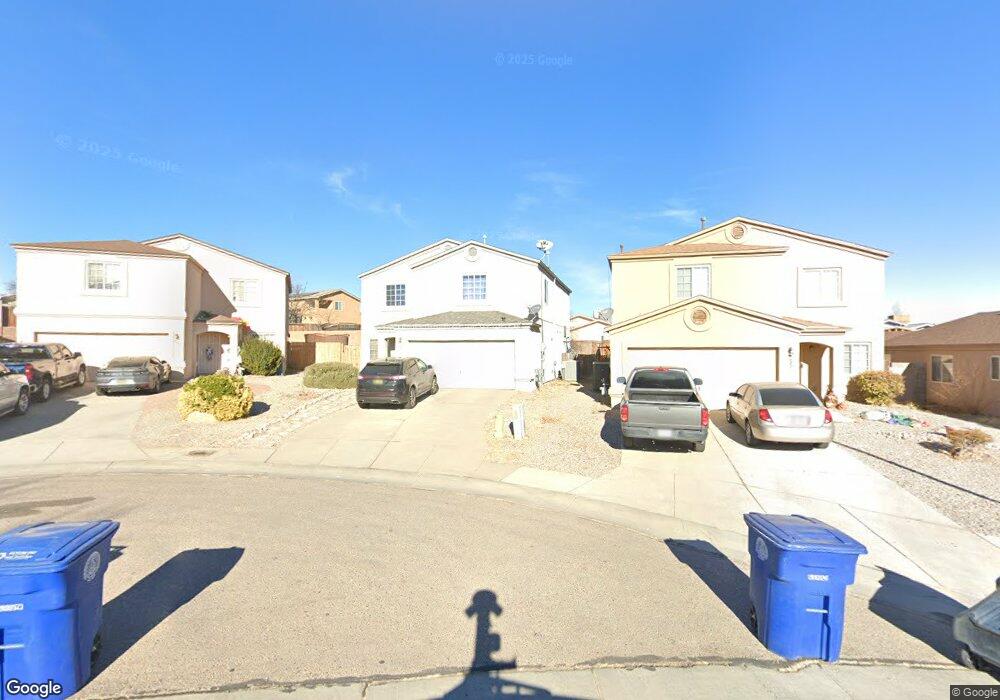
9627 Rowen Rd Albuquerque, NM 87121
Southwest Heights NeighborhoodEstimated Value: $301,000 - $313,000
3
Beds
3
Baths
1,938
Sq Ft
$159/Sq Ft
Est. Value
About This Home
This home is located at 9627 Rowen Rd, Albuquerque, NM 87121 and is currently estimated at $308,592, approximately $159 per square foot. 9627 Rowen Rd is a home located in Bernalillo County with nearby schools including Helen Cordero Primary School, Edward Gonzales Elementary School, and Jimmy Carter Middle School.
Ownership History
Date
Name
Owned For
Owner Type
Purchase Details
Closed on
May 18, 2015
Sold by
Novak Daniel J
Bought by
Downey Jarod E
Current Estimated Value
Home Financials for this Owner
Home Financials are based on the most recent Mortgage that was taken out on this home.
Original Mortgage
$145,319
Outstanding Balance
$112,232
Interest Rate
3.75%
Mortgage Type
FHA
Estimated Equity
$196,360
Purchase Details
Closed on
Feb 23, 2012
Sold by
Cook Theresa and Cook Garrett
Bought by
Novak Daniel J
Home Financials for this Owner
Home Financials are based on the most recent Mortgage that was taken out on this home.
Original Mortgage
$134,988
Interest Rate
5.5%
Mortgage Type
FHA
Purchase Details
Closed on
Dec 31, 2002
Sold by
Vantage Builders Inc
Bought by
Kimbrough Billy F and Baca Rose F
Home Financials for this Owner
Home Financials are based on the most recent Mortgage that was taken out on this home.
Original Mortgage
$132,109
Interest Rate
5.96%
Mortgage Type
FHA
Create a Home Valuation Report for This Property
The Home Valuation Report is an in-depth analysis detailing your home's value as well as a comparison with similar homes in the area
Home Values in the Area
Average Home Value in this Area
Purchase History
| Date | Buyer | Sale Price | Title Company |
|---|---|---|---|
| Downey Jarod E | -- | Old Republic Natl Title Ins | |
| Novak Daniel J | -- | First American Title Ins Co | |
| Kimbrough Billy F | -- | Fidelity National Title Ins |
Source: Public Records
Mortgage History
| Date | Status | Borrower | Loan Amount |
|---|---|---|---|
| Open | Downey Jarod E | $145,319 | |
| Previous Owner | Novak Daniel J | $134,988 | |
| Previous Owner | Kimbrough Billy F | $132,109 |
Source: Public Records
Tax History Compared to Growth
Tax History
| Year | Tax Paid | Tax Assessment Tax Assessment Total Assessment is a certain percentage of the fair market value that is determined by local assessors to be the total taxable value of land and additions on the property. | Land | Improvement |
|---|---|---|---|---|
| 2024 | $2,160 | $51,205 | $10,991 | $40,214 |
| 2023 | $2,124 | $49,713 | $10,671 | $39,042 |
| 2022 | $2,053 | $48,266 | $10,360 | $37,906 |
| 2021 | $1,984 | $46,861 | $10,059 | $36,802 |
| 2020 | $1,952 | $45,496 | $9,766 | $35,730 |
| 2019 | $1,968 | $45,896 | $9,766 | $36,130 |
| 2018 | $1,942 | $45,896 | $9,766 | $36,130 |
| 2017 | $1,882 | $45,590 | $10,059 | $35,531 |
| 2016 | $1,883 | $44,263 | $9,766 | $34,497 |
| 2015 | $38,463 | $38,463 | $9,766 | $28,697 |
| 2014 | -- | $38,463 | $9,766 | $28,697 |
| 2013 | -- | $43,607 | $9,766 | $33,841 |
Source: Public Records
Map
Nearby Homes
- 9608 Water Stone Rd SW
- 9900 Ladder Ranch Ln SW
- 537 Sky Tower St SW
- 615 Avanti St SW
- 9931 Hideout Ln SW
- 9915 King Ranch Ln SW
- 10000 Bridle Falls Ave SW
- 632 Foyt Dr SW
- 9409 Desert Pine Ave SW
- 805 Malachite Dr SW
- 9736 Westbound Ave SW
- 8930 Thor Rd SW
- 700 Lone Pine Dr SW
- 0 Sage & 90th St SW Unit 1083191
- 9621 Central Ave NW Unit C
- 8700 Thor Rd SW
- 8523 Vista Serena Ln SW
- 8709 Odin Rd SW
- 10316 Andalusian Ave SW
- 519 Fenwick Place SW
- 9627 Rowen Rd SW
- 9623 Rowen Rd SW
- 9623 Rowen Rd SW
- 9631 Rowen Rd SW
- 9635 Rowen Rd SW
- 9619 Rowen Rd SW
- 9628 Tristani Rd SW
- 9624 Tristani Rd SW
- 9620 Tristani Rd SW
- 9639 Rowen Rd SW
- 9615 Rowen Rd SW
- 508 Hartman Dr SW
- 9616 Tristani Rd SW
- 520 Hartman Dr SW
- 9640 Rowen Rd SW
- 9643 Rowen Rd SW
- 9612 Tristani Rd SW
- 524 Hartman Dr SW
- 9609 Rowen Rd SW
- 9644 Rowen Rd SW