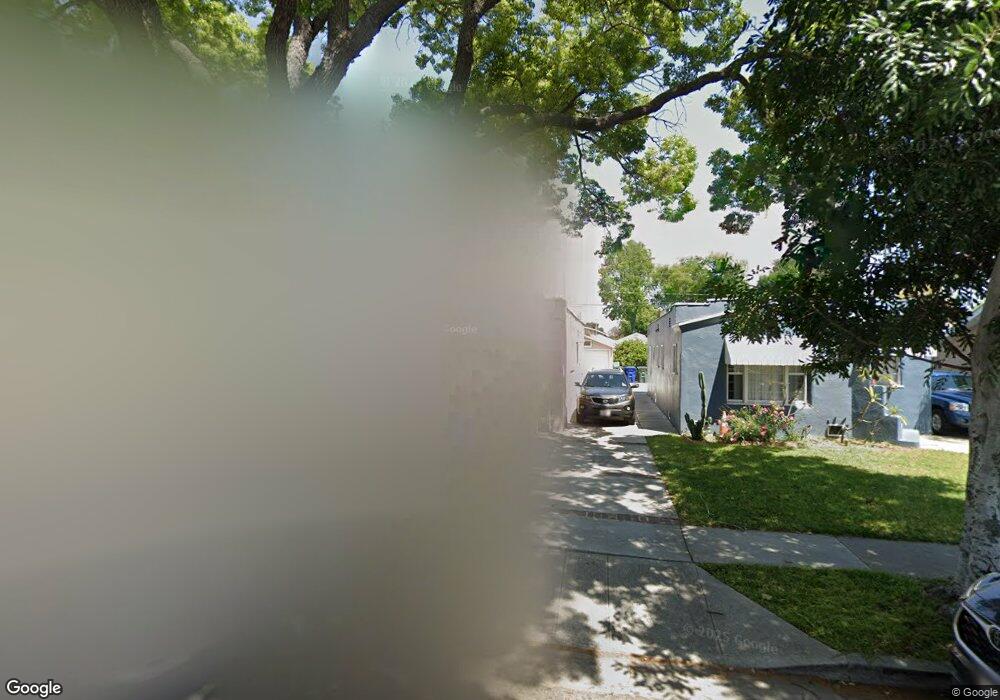
9628 Bowman Ave South Gate, CA 90280
Estimated Value: $581,377 - $711,000
2
Beds
1
Bath
908
Sq Ft
$701/Sq Ft
Est. Value
About This Home
This home is located at 9628 Bowman Ave, South Gate, CA 90280 and is currently estimated at $636,594, approximately $701 per square foot. 9628 Bowman Ave is a home located in Los Angeles County with nearby schools including Bryson Avenue Elementary School, South Gate Middle School, and Southeast Middle School.
Ownership History
Date
Name
Owned For
Owner Type
Purchase Details
Closed on
Mar 23, 2015
Sold by
Pe A Francis L K
Bought by
Pe A Francis L K and Araceli Pe A
Current Estimated Value
Purchase Details
Closed on
Jun 15, 1998
Sold by
Washington Mutual Bank
Bought by
Pea Francis L K
Home Financials for this Owner
Home Financials are based on the most recent Mortgage that was taken out on this home.
Original Mortgage
$123,211
Outstanding Balance
$24,670
Interest Rate
7.06%
Mortgage Type
FHA
Estimated Equity
$611,924
Purchase Details
Closed on
Dec 10, 1997
Sold by
Calderon Jairo and Calderson Carmen
Bought by
Washington Mutual Bank Fa and American Svgs Bank Fa
Purchase Details
Closed on
Feb 21, 1995
Sold by
Magana Agustin and Magana Inez
Bought by
Calderon Jairo
Home Financials for this Owner
Home Financials are based on the most recent Mortgage that was taken out on this home.
Original Mortgage
$139,345
Interest Rate
8.81%
Create a Home Valuation Report for This Property
The Home Valuation Report is an in-depth analysis detailing your home's value as well as a comparison with similar homes in the area
Home Values in the Area
Average Home Value in this Area
Purchase History
| Date | Buyer | Sale Price | Title Company |
|---|---|---|---|
| Pe A Francis L K | -- | None Available | |
| Pea Francis L K | $124,000 | Investors Title Company | |
| Washington Mutual Bank Fa | $130,000 | Stewart Title | |
| Calderon Jairo | $155,000 | World Title Company |
Source: Public Records
Mortgage History
| Date | Status | Borrower | Loan Amount |
|---|---|---|---|
| Open | Pea Francis L K | $123,211 | |
| Previous Owner | Calderon Jairo | $139,345 |
Source: Public Records
Tax History
| Year | Tax Paid | Tax Assessment Tax Assessment Total Assessment is a certain percentage of the fair market value that is determined by local assessors to be the total taxable value of land and additions on the property. | Land | Improvement |
|---|---|---|---|---|
| 2025 | $2,740 | $194,364 | $121,953 | $72,411 |
| 2024 | $2,740 | $190,554 | $119,562 | $70,992 |
| 2023 | $2,694 | $186,818 | $117,218 | $69,600 |
| 2022 | $2,573 | $183,156 | $114,920 | $68,236 |
| 2021 | $2,540 | $179,566 | $112,667 | $66,899 |
| 2019 | $2,461 | $174,242 | $109,326 | $64,916 |
| 2018 | $2,362 | $170,827 | $107,183 | $63,644 |
| 2016 | $2,249 | $164,196 | $103,022 | $61,174 |
| 2015 | $2,213 | $161,731 | $101,475 | $60,256 |
| 2014 | $2,214 | $158,564 | $99,488 | $59,076 |
Source: Public Records
Map
Nearby Homes
- 9616 Bowman Ave
- 9525 Bowman Ave
- 9505 Bryson Ave
- 9718 Otis St
- 9329 Mcnerney Ave
- 9643 Mallison Ave
- 9710 San Miguel Ave
- 8976 Mcnerney Ave Unit A-B
- 9415 Annetta Ave
- 8963 Bowman Ave
- 9601 San Juan Ave
- 9723 San Juan Ave
- 8952 Dudlext Ave
- 10414 Dorothy Ave
- 9826 California Ave
- 10309 Washington Ave
- 9929 Rosewood Ave
- 9222 California Ave
- 10231 San Carlos Ave
- 4087 Abbott Rd
- 9632 Bowman Ave
- 9624 Bowman Ave
- 9636 Bowman Ave
- 9620 Bowman Ave
- 9644 Bowman Ave
- 9629 Alexander Ave
- 9625 Alexander Ave
- 9612 Bowman Ave
- 9635 Alexander Ave
- 9621 Alexander Ave
- 9608 Bowman Ave
- 9641 Alexander Ave
- 9629 Bowman Ave
- 9633 Bowman Ave
- 9625 Bowman Ave
- 9637 Bowman Ave
- 9645 Bowman Ave
- 9606 Bowman Ave Unit B
- 9606 Bowman Ave
- 9617 Bowman Ave
Your Personal Tour Guide
Ask me questions while you tour the home.