963 13th St Marion, IA 52302
Estimated Value: $167,000 - $192,000
3
Beds
2
Baths
1,200
Sq Ft
$148/Sq Ft
Est. Value
About This Home
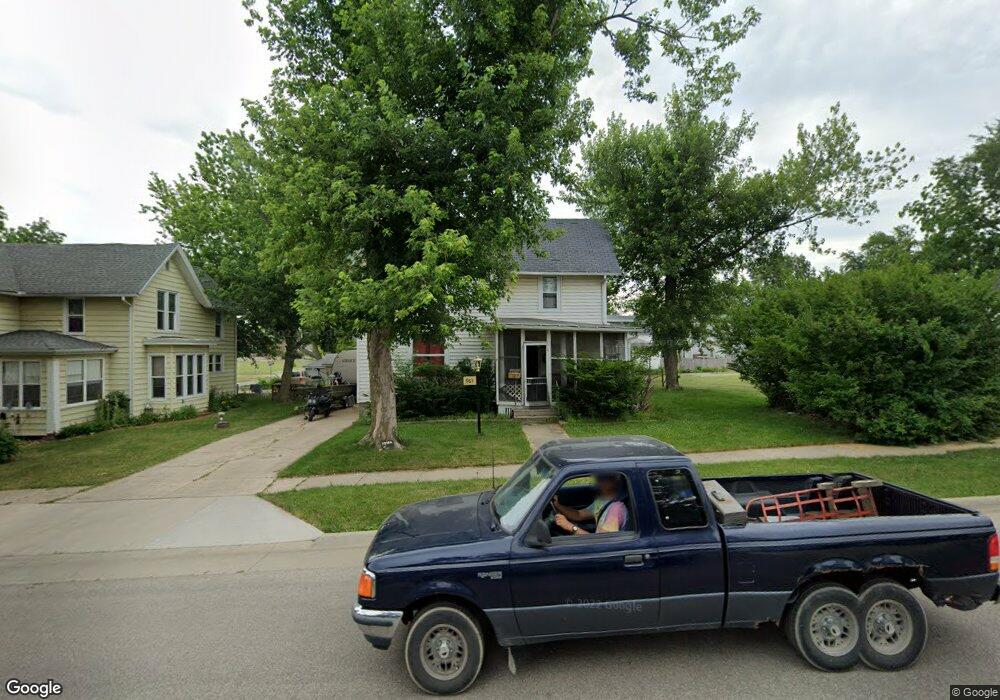
This home is located at 963 13th St, Marion, IA 52302 and is currently estimated at $177,692, approximately $148 per square foot. 963 13th St is a home located in Linn County with nearby schools including Francis Marion Intermediate School, Vernon Middle School, and Marion High School.
Ownership History
Date
Name
Owned For
Owner Type
Purchase Details
Closed on
Jun 23, 2023
Sold by
Bevard Properties Lc
Bought by
Bevard Properties Lc
Current Estimated Value
Purchase Details
Closed on
Apr 15, 2014
Sold by
Back Gregory Burnett and Beck Patricia Kay
Bought by
Bevard Properties Lc Series 21
Home Financials for this Owner
Home Financials are based on the most recent Mortgage that was taken out on this home.
Original Mortgage
$97,900
Interest Rate
4.33%
Mortgage Type
Future Advance Clause Open End Mortgage
Purchase Details
Closed on
Apr 26, 2000
Sold by
Brandt Linda Sue and Beck Patricia Kay
Bought by
Beck Gregory Burnett and Beck Patricia Kay
Home Financials for this Owner
Home Financials are based on the most recent Mortgage that was taken out on this home.
Original Mortgage
$50,000
Interest Rate
8%
Create a Home Valuation Report for This Property
The Home Valuation Report is an in-depth analysis detailing your home's value as well as a comparison with similar homes in the area
Home Values in the Area
Average Home Value in this Area
Purchase History
| Date | Buyer | Sale Price | Title Company |
|---|---|---|---|
| Bevard Properties Lc | -- | None Listed On Document | |
| Bevard Properties Lc Series 21 | $56,904 | None Available | |
| Beck Gregory Burnett | $34,500 | -- |
Source: Public Records
Mortgage History
| Date | Status | Borrower | Loan Amount |
|---|---|---|---|
| Previous Owner | Bevard Properties Lc Series 21 | $97,900 | |
| Previous Owner | Beck Gregory Burnett | $50,000 |
Source: Public Records
Tax History Compared to Growth
Tax History
| Year | Tax Paid | Tax Assessment Tax Assessment Total Assessment is a certain percentage of the fair market value that is determined by local assessors to be the total taxable value of land and additions on the property. | Land | Improvement |
|---|---|---|---|---|
| 2025 | $2,878 | $156,900 | $18,000 | $138,900 |
| 2024 | $2,640 | $153,400 | $18,000 | $135,400 |
| 2023 | $2,640 | $153,400 | $18,000 | $135,400 |
| 2022 | $2,550 | $118,600 | $18,000 | $100,600 |
| 2021 | $2,314 | $118,600 | $18,000 | $100,600 |
| 2020 | $2,314 | $102,400 | $18,000 | $84,400 |
| 2019 | $2,276 | $102,400 | $18,000 | $84,400 |
| 2018 | $2,226 | $101,000 | $18,000 | $83,000 |
| 2017 | $2,210 | $97,900 | $18,000 | $79,900 |
| 2016 | $2,178 | $97,900 | $18,000 | $79,900 |
| 2015 | $2,170 | $97,900 | $18,000 | $79,900 |
| 2014 | $2,170 | $97,900 | $18,000 | $79,900 |
| 2013 | $1,824 | $97,900 | $18,000 | $79,900 |
Source: Public Records
Map
Nearby Homes