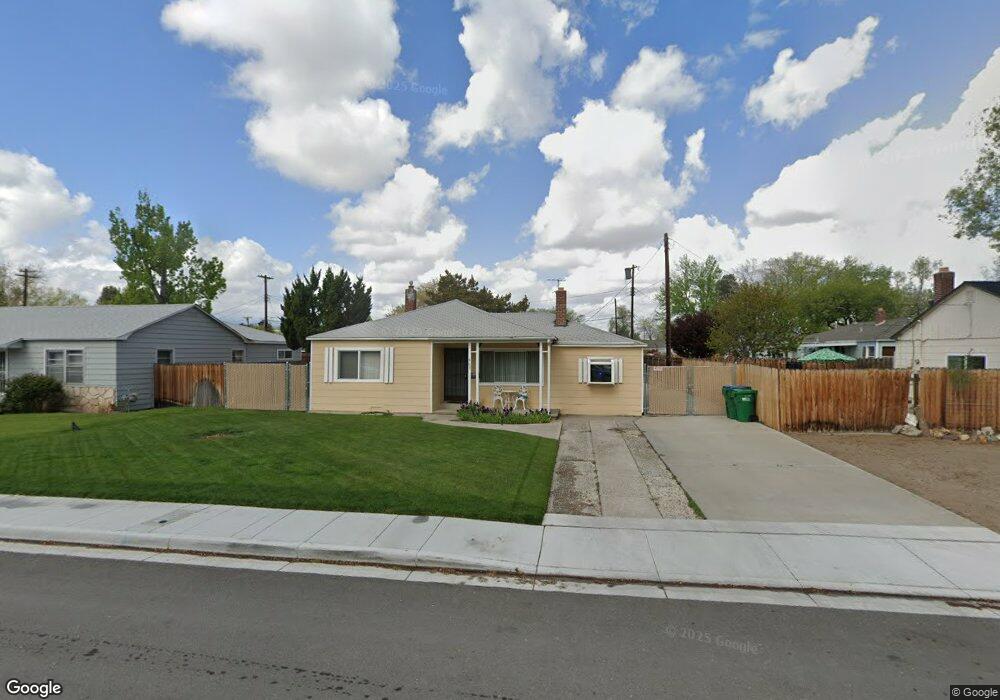
963 5th St Sparks, NV 89431
Downtown Sparks NeighborhoodEstimated Value: $340,000 - $388,000
2
Beds
1
Bath
855
Sq Ft
$417/Sq Ft
Est. Value
About This Home
This home is located at 963 5th St, Sparks, NV 89431 and is currently estimated at $356,925, approximately $417 per square foot. 963 5th St is a home located in Washoe County with nearby schools including Greenbrae Elementary School, George L Dilworth Middle School, and Sparks High School.
Ownership History
Date
Name
Owned For
Owner Type
Purchase Details
Closed on
Jun 26, 1998
Sold by
Bucher Linda L
Bought by
Hilbert Brian E
Current Estimated Value
Home Financials for this Owner
Home Financials are based on the most recent Mortgage that was taken out on this home.
Original Mortgage
$108,896
Outstanding Balance
$22,615
Interest Rate
7.17%
Mortgage Type
FHA
Estimated Equity
$334,310
Create a Home Valuation Report for This Property
The Home Valuation Report is an in-depth analysis detailing your home's value as well as a comparison with similar homes in the area
Home Values in the Area
Average Home Value in this Area
Purchase History
| Date | Buyer | Sale Price | Title Company |
|---|---|---|---|
| Hilbert Brian E | $110,000 | Western Title Company Inc |
Source: Public Records
Mortgage History
| Date | Status | Borrower | Loan Amount |
|---|---|---|---|
| Open | Hilbert Brian E | $108,896 |
Source: Public Records
Tax History Compared to Growth
Tax History
| Year | Tax Paid | Tax Assessment Tax Assessment Total Assessment is a certain percentage of the fair market value that is determined by local assessors to be the total taxable value of land and additions on the property. | Land | Improvement |
|---|---|---|---|---|
| 2025 | $883 | $51,073 | $33,565 | $17,508 |
| 2024 | $883 | $47,381 | $30,065 | $17,316 |
| 2023 | $812 | $47,073 | $31,325 | $15,748 |
| 2022 | $752 | $38,874 | $26,180 | $12,694 |
| 2021 | $697 | $30,338 | $17,955 | $12,383 |
| 2020 | $654 | $29,224 | $16,940 | $12,284 |
| 2019 | $623 | $27,546 | $15,890 | $11,656 |
| 2018 | $594 | $22,909 | $11,725 | $11,184 |
| 2017 | $571 | $21,519 | $10,395 | $11,124 |
| 2016 | $557 | $20,438 | $9,345 | $11,093 |
| 2015 | $556 | $18,627 | $7,700 | $10,927 |
| 2014 | $539 | $16,804 | $6,440 | $10,364 |
| 2013 | -- | $14,352 | $4,270 | $10,082 |
Source: Public Records
Map
Nearby Homes