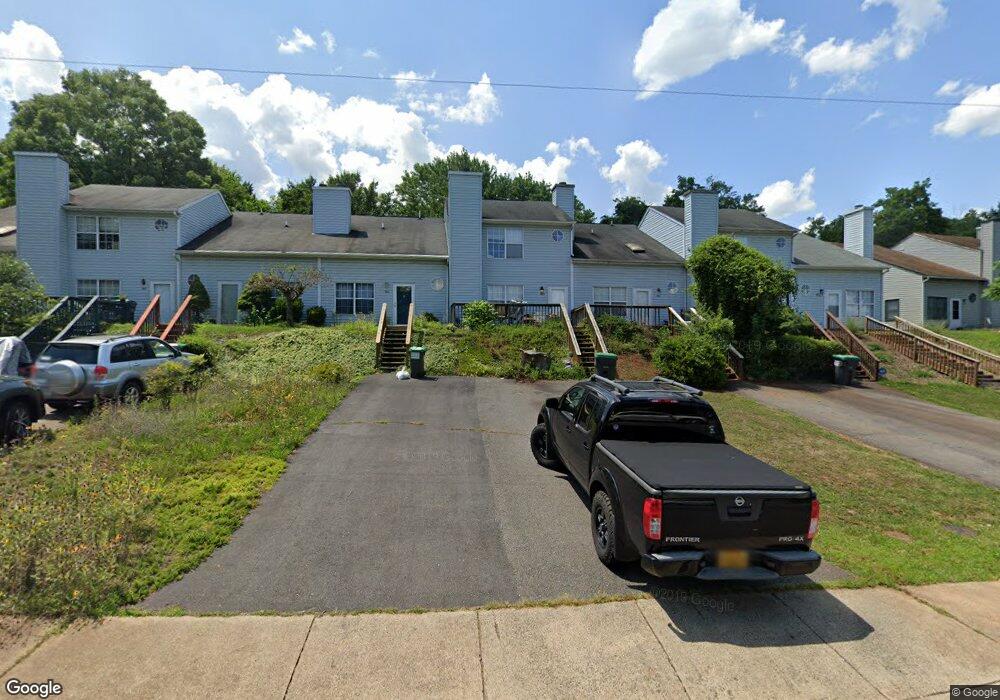
963 Rives St Charlottesville, VA 22902
Belmont NeighborhoodEstimated Value: $299,000 - $308,000
3
Beds
2
Baths
1,120
Sq Ft
$271/Sq Ft
Est. Value
About This Home
This home is located at 963 Rives St, Charlottesville, VA 22902 and is currently estimated at $303,393, approximately $270 per square foot. 963 Rives St is a home located in Charlottesville City with nearby schools including Summit Elementary School, Buford Middle School, and Charlottesville High School.
Ownership History
Date
Name
Owned For
Owner Type
Purchase Details
Closed on
Jul 15, 2022
Sold by
Zimmerman Brady P
Bought by
Choctaw American Insurance Inc
Current Estimated Value
Home Financials for this Owner
Home Financials are based on the most recent Mortgage that was taken out on this home.
Original Mortgage
$2,460
Outstanding Balance
$2,084
Interest Rate
4.67%
Mortgage Type
Stand Alone Second
Estimated Equity
$301,309
Purchase Details
Closed on
May 22, 2013
Bought by
Zimmerman Brady P
Create a Home Valuation Report for This Property
The Home Valuation Report is an in-depth analysis detailing your home's value as well as a comparison with similar homes in the area
Home Values in the Area
Average Home Value in this Area
Purchase History
| Date | Buyer | Sale Price | Title Company |
|---|---|---|---|
| Choctaw American Insurance Inc | $246,000 | Old Republic National Title In | |
| Zimmerman Brady P | $147,000 | -- |
Source: Public Records
Mortgage History
| Date | Status | Borrower | Loan Amount |
|---|---|---|---|
| Open | Choctaw American Insurance Inc | $2,460 | |
| Open | Choctaw American Insurance Inc | $241,544 |
Source: Public Records
Tax History
| Year | Tax Paid | Tax Assessment Tax Assessment Total Assessment is a certain percentage of the fair market value that is determined by local assessors to be the total taxable value of land and additions on the property. | Land | Improvement |
|---|---|---|---|---|
| 2025 | $2,681 | $267,700 | $55,000 | $212,700 |
| 2024 | $2,681 | $255,300 | $55,000 | $200,300 |
| 2023 | $2,382 | $242,100 | $47,500 | $194,600 |
| 2022 | $1,763 | $177,600 | $34,500 | $143,100 |
| 2021 | $1,603 | $162,700 | $34,500 | $128,200 |
| 2020 | $1,650 | $167,600 | $44,000 | $123,600 |
| 2019 | $1,650 | $167,600 | $44,000 | $123,600 |
| 2018 | $839 | $170,600 | $47,000 | $123,600 |
| 2017 | $1,601 | $162,500 | $44,800 | $117,700 |
| 2016 | $1,495 | $152,100 | $40,000 | $112,100 |
| 2015 | $1,495 | $152,100 | $40,000 | $112,100 |
| 2014 | $1,495 | $152,100 | $40,000 | $112,100 |
Source: Public Records
Map
Nearby Homes
- 117 Hartford Ct
- 1013 Linden Ave Unit H
- 1108 Blenheim Ave
- 1011 Stonehenge Ave
- 1003 Stonehenge Ave
- 1007 Montrose Ave
- 419 Quarry Rd
- 919 Druid Ave
- 915 Altavista Ave
- 611 Rives St
- 908 Rockland Ave
- 109 Junction Ln
- 201 Palatine Ave
- 2A Scottsville Rd
- 1641 Meridian St
- 715 Elliott Ave
- 1642 Meridian St
- 1107 Myrtle St
- 1638 Rialto St
Your Personal Tour Guide
Ask me questions while you tour the home.