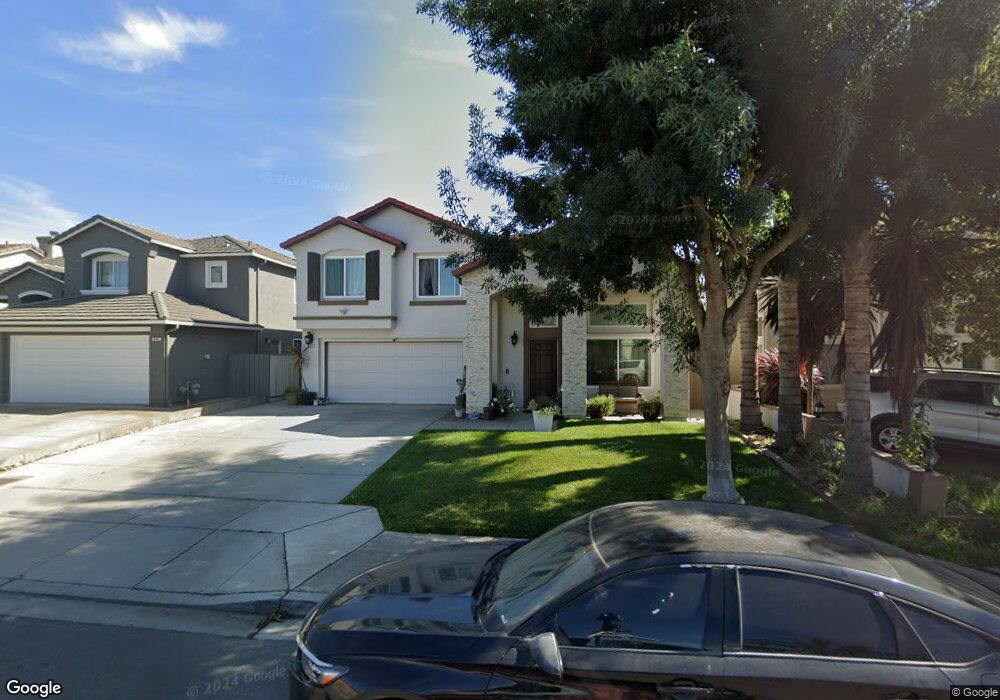
963 Sage Ct Salinas, CA 93905
East Salinas NeighborhoodEstimated Value: $704,000 - $759,043
4
Beds
4
Baths
1,700
Sq Ft
$434/Sq Ft
Est. Value
About This Home
This home is located at 963 Sage Ct, Salinas, CA 93905 and is currently estimated at $737,011, approximately $433 per square foot. 963 Sage Ct is a home located in Monterey County with nearby schools including Oscar F. Loya Elementary School, La Paz Middle School, and Alisal High School.
Ownership History
Date
Name
Owned For
Owner Type
Purchase Details
Closed on
Jun 9, 2003
Sold by
Ponce Jesus and Ponce Christina
Bought by
Casillas Jose and Casillas Griselda
Current Estimated Value
Home Financials for this Owner
Home Financials are based on the most recent Mortgage that was taken out on this home.
Original Mortgage
$291,200
Outstanding Balance
$125,985
Interest Rate
5.61%
Mortgage Type
Purchase Money Mortgage
Estimated Equity
$611,026
Purchase Details
Closed on
Sep 27, 1999
Sold by
Standard Pacific Corp
Bought by
Ponce Jesus and Ponce Christina
Home Financials for this Owner
Home Financials are based on the most recent Mortgage that was taken out on this home.
Original Mortgage
$136,900
Interest Rate
7.97%
Create a Home Valuation Report for This Property
The Home Valuation Report is an in-depth analysis detailing your home's value as well as a comparison with similar homes in the area
Home Values in the Area
Average Home Value in this Area
Purchase History
| Date | Buyer | Sale Price | Title Company |
|---|---|---|---|
| Casillas Jose | $364,000 | Old Republic Title | |
| Ponce Jesus | $207,000 | First American Title Co |
Source: Public Records
Mortgage History
| Date | Status | Borrower | Loan Amount |
|---|---|---|---|
| Open | Casillas Jose | $291,200 | |
| Previous Owner | Ponce Jesus | $136,900 | |
| Closed | Casillas Jose | $72,800 |
Source: Public Records
Tax History
| Year | Tax Paid | Tax Assessment Tax Assessment Total Assessment is a certain percentage of the fair market value that is determined by local assessors to be the total taxable value of land and additions on the property. | Land | Improvement |
|---|---|---|---|---|
| 2025 | $7,006 | $527,172 | $246,205 | $280,967 |
| 2024 | $7,006 | $516,836 | $241,378 | $275,458 |
| 2023 | $6,921 | $506,703 | $236,646 | $270,057 |
| 2022 | $6,244 | $496,768 | $232,006 | $264,762 |
| 2021 | $6,240 | $487,028 | $227,457 | $259,571 |
| 2020 | $6,165 | $482,035 | $225,125 | $256,910 |
| 2019 | $6,353 | $472,584 | $220,711 | $251,873 |
| 2018 | $5,752 | $444,000 | $207,000 | $237,000 |
| 2017 | $5,913 | $432,000 | $202,000 | $230,000 |
| 2016 | $4,973 | $374,000 | $175,000 | $199,000 |
| 2015 | $4,985 | $373,000 | $174,000 | $199,000 |
| 2014 | $4,196 | $318,000 | $149,000 | $169,000 |
Source: Public Records
Map
Nearby Homes
- 1544 Saguaro Dr Unit 4
- 1046 C St
- 755 Pino Way
- 1126 Pacific Ave
- 11 Fresa Place
- 10 Rex Cir
- 15 Cheswick Cir
- 1099 Twin Creeks Dr
- 948 Rider Ave
- 1725 Great Island St
- 18 Hancock Cir
- 1914 Whitman St
- 933 Acosta Plaza Unit 35
- 34 Whitman Cir
- 1849 Bradbury St
- 1918 Bradbury St
- 980 Longfellow Dr
- 230 Paloma Ave
- 1960 Bradbury St
- 11 E Laurel Dr
Your Personal Tour Guide
Ask me questions while you tour the home.