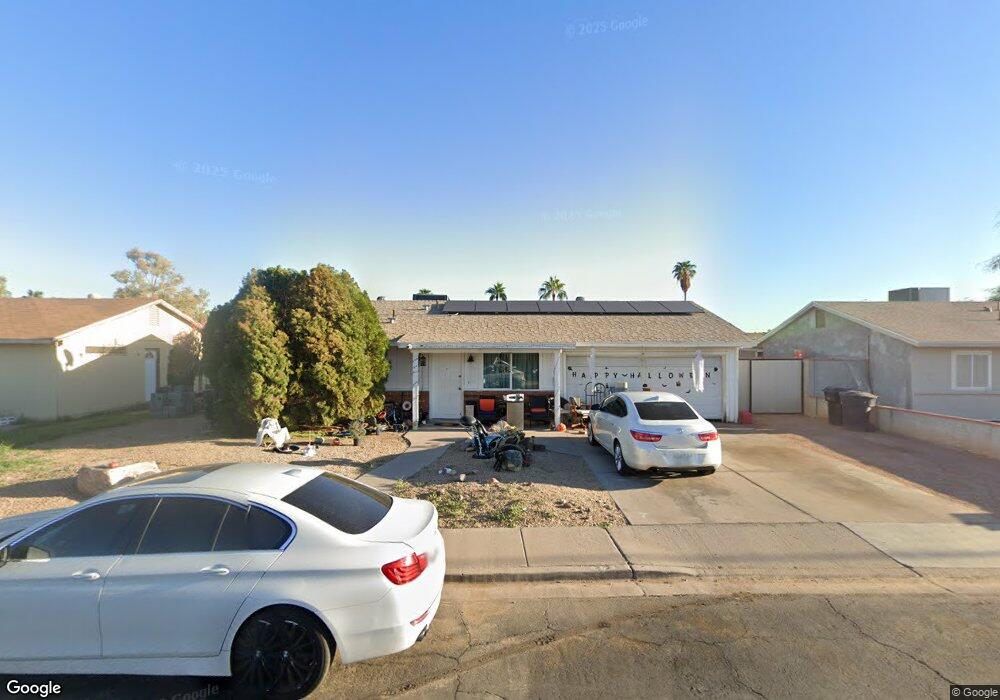
963 W Hillview St Mesa, AZ 85201
Riverview NeighborhoodEstimated Value: $249,000 - $346,633
3
Beds
2
Baths
1,008
Sq Ft
$281/Sq Ft
Est. Value
About This Home
This home is located at 963 W Hillview St, Mesa, AZ 85201 and is currently estimated at $283,658, approximately $281 per square foot. 963 W Hillview St is a home located in Maricopa County with nearby schools including Whittier Elementary School, Franklin at Brimhall Elementary School, and Franklin West Elementary School.
Ownership History
Date
Name
Owned For
Owner Type
Purchase Details
Closed on
Nov 19, 2025
Sold by
Correll Randy Dell and Weaver Trisha Lynn
Bought by
Wholesale Auction Homes Llc
Current Estimated Value
Home Financials for this Owner
Home Financials are based on the most recent Mortgage that was taken out on this home.
Original Mortgage
$283,000
Outstanding Balance
$282,198
Interest Rate
6.3%
Mortgage Type
New Conventional
Estimated Equity
$1,460
Purchase Details
Closed on
Oct 15, 2019
Sold by
Correll Randy Dell
Bought by
Correll Randy Dell and Weaver Trisha Lynn
Purchase Details
Closed on
Oct 18, 2005
Sold by
Correll Karie
Bought by
Correll Randy
Home Financials for this Owner
Home Financials are based on the most recent Mortgage that was taken out on this home.
Original Mortgage
$151,600
Interest Rate
5.74%
Mortgage Type
Fannie Mae Freddie Mac
Purchase Details
Closed on
Oct 17, 2005
Sold by
Schutte David J and Schutte Jody L
Bought by
Correll Randy
Home Financials for this Owner
Home Financials are based on the most recent Mortgage that was taken out on this home.
Original Mortgage
$151,600
Interest Rate
5.74%
Mortgage Type
Fannie Mae Freddie Mac
Create a Home Valuation Report for This Property
The Home Valuation Report is an in-depth analysis detailing your home's value as well as a comparison with similar homes in the area
Home Values in the Area
Average Home Value in this Area
Purchase History
| Date | Buyer | Sale Price | Title Company |
|---|---|---|---|
| Wholesale Auction Homes Llc | $270,000 | Pioneer Title Agency | |
| Correll Randy Dell | -- | None Available | |
| Correll Randy | -- | Title Security Agency Of Az | |
| Correll Randy | $195,000 | Title Security Agency Of Az |
Source: Public Records
Mortgage History
| Date | Status | Borrower | Loan Amount |
|---|---|---|---|
| Open | Wholesale Auction Homes Llc | $283,000 | |
| Previous Owner | Correll Randy | $151,600 | |
| Previous Owner | Correll Randy | $151,600 |
Source: Public Records
Tax History
| Year | Tax Paid | Tax Assessment Tax Assessment Total Assessment is a certain percentage of the fair market value that is determined by local assessors to be the total taxable value of land and additions on the property. | Land | Improvement |
|---|---|---|---|---|
| 2025 | $776 | $9,338 | -- | -- |
| 2024 | $924 | $8,894 | -- | -- |
| 2023 | $924 | $23,650 | $4,730 | $18,920 |
| 2022 | $905 | $18,460 | $3,690 | $14,770 |
| 2021 | $1,043 | $16,180 | $3,230 | $12,950 |
| 2020 | $777 | $15,070 | $3,010 | $12,060 |
| 2019 | $720 | $12,720 | $2,540 | $10,180 |
| 2018 | $688 | $11,580 | $2,310 | $9,270 |
| 2017 | $666 | $10,830 | $2,160 | $8,670 |
| 2016 | $654 | $9,510 | $1,900 | $7,610 |
| 2015 | $617 | $7,730 | $1,540 | $6,190 |
Source: Public Records
Map
Nearby Homes
- 1048 W Heather Dr
- 1500 N Markdale Unit 41
- 1635 N Beverly St
- 1559 N Upland Cir
- 1229 N Alma School Rd Unit 1
- 860 W Mountain View Dr
- 1027 N Revere
- 625 W Mckellips Rd Unit 163
- 625 W Mckellips Rd Unit 246
- 625 W Mckellips Rd Unit 147
- 625 W Mckellips Rd Unit 213
- 434 W Ivyglen St Unit 105
- 920 N Cherry
- 424 W Brown Rd Unit 105
- 861 N Revere Unit E
- 805 N Westwood
- 837 N Revere Unit E
- 816 N Revere
- 1265 W Ellis St
- 1051 W Dixon St
- 1005 W Hillview St
- 955 W Hillview St
- 956 W Hackamore St Unit 2
- 964 W Hackamore St
- 964 W Hackamore St
- 948 W Hackamore St
- 1017 W Hillview St
- 947 W Hillview St
- 1004 W Hillview St
- 962 W Hillview St
- 1016 W Hillview St Unit 2
- 954 W Hillview St
- 940 W Hackamore St
- 1033 W Hillview St
- 1002 W Hackamore St
- 939 W Hillview St Unit 2
- 1030 W Hillview St
- 1014 W Hackamore St
- 946 W Hillview St
- 957 W Hackamore St
Your Personal Tour Guide
Ask me questions while you tour the home.