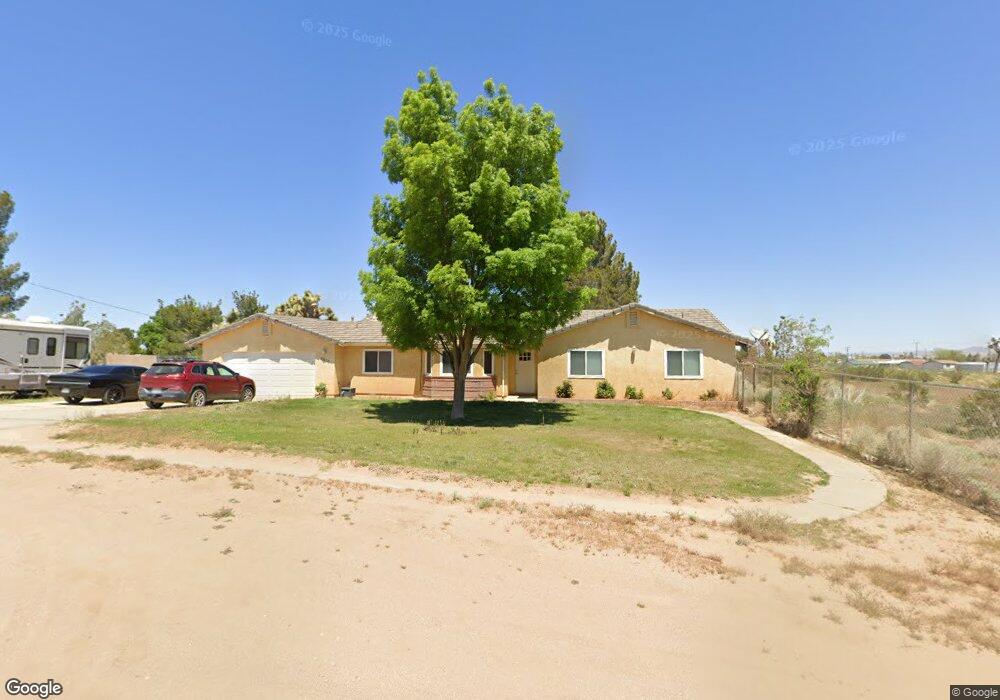
9630 Solano Rd Victorville, CA 92392
Estimated Value: $424,000 - $571,000
3
Beds
2
Baths
1,861
Sq Ft
$263/Sq Ft
Est. Value
About This Home
This home is located at 9630 Solano Rd, Victorville, CA 92392 and is currently estimated at $489,332, approximately $262 per square foot. 9630 Solano Rd is a home located in San Bernardino County with nearby schools including Baldy Mesa Elementary School, Quail Valley Middle School, and Serrano High School.
Ownership History
Date
Name
Owned For
Owner Type
Purchase Details
Closed on
Jun 27, 2007
Sold by
Kinney Lawrence C
Bought by
Kinney Lawrence C and Perez Terri Lynn
Current Estimated Value
Home Financials for this Owner
Home Financials are based on the most recent Mortgage that was taken out on this home.
Original Mortgage
$250,000
Outstanding Balance
$202,057
Interest Rate
6.21%
Mortgage Type
New Conventional
Estimated Equity
$287,275
Purchase Details
Closed on
Feb 6, 1997
Sold by
Federal National Mortgage Association
Bought by
Kinney Lawrence C
Home Financials for this Owner
Home Financials are based on the most recent Mortgage that was taken out on this home.
Original Mortgage
$78,550
Interest Rate
7.86%
Mortgage Type
Seller Take Back
Purchase Details
Closed on
Sep 27, 1996
Sold by
Haley Kenneth W and Haley Kathleen M
Bought by
Federal National Mortgage Association
Purchase Details
Closed on
Aug 22, 1994
Sold by
Haley Kathleen Marie
Bought by
Haley Kenneth Wayne
Create a Home Valuation Report for This Property
The Home Valuation Report is an in-depth analysis detailing your home's value as well as a comparison with similar homes in the area
Home Values in the Area
Average Home Value in this Area
Purchase History
| Date | Buyer | Sale Price | Title Company |
|---|---|---|---|
| Kinney Lawrence C | -- | First American Title Company | |
| Kinney Lawrence C | $81,000 | First American Title Ins Co | |
| Federal National Mortgage Association | $80,500 | First Southwestern Title Co | |
| Haley Kenneth Wayne | -- | -- |
Source: Public Records
Mortgage History
| Date | Status | Borrower | Loan Amount |
|---|---|---|---|
| Open | Kinney Lawrence C | $250,000 | |
| Closed | Kinney Lawrence C | $78,550 |
Source: Public Records
Tax History Compared to Growth
Tax History
| Year | Tax Paid | Tax Assessment Tax Assessment Total Assessment is a certain percentage of the fair market value that is determined by local assessors to be the total taxable value of land and additions on the property. | Land | Improvement |
|---|---|---|---|---|
| 2025 | $3,679 | $131,923 | $32,573 | $99,350 |
| 2024 | $3,679 | $129,336 | $31,934 | $97,402 |
| 2023 | $3,658 | $126,800 | $31,308 | $95,492 |
| 2022 | $3,620 | $124,314 | $30,694 | $93,620 |
| 2021 | $3,589 | $121,876 | $30,092 | $91,784 |
| 2020 | $3,568 | $120,626 | $29,783 | $90,843 |
| 2019 | $3,541 | $118,261 | $29,199 | $89,062 |
| 2018 | $3,357 | $115,942 | $28,626 | $87,316 |
| 2017 | $3,294 | $113,669 | $28,065 | $85,604 |
| 2016 | $3,233 | $111,440 | $27,515 | $83,925 |
| 2015 | $3,232 | $109,766 | $27,102 | $82,664 |
| 2014 | $1,316 | $107,616 | $26,571 | $81,045 |
Source: Public Records
Map
Nearby Homes
- 9915 Le Panto Rd
- 10124 Alta Mesa Rd
- 10757 Beaver Ave
- 0 Braceo St
- 0 Appleton St Unit IG25170576
- 10626 Beaver Ave
- 0 Barker Rd
- 9121 4th St
- 11164 White Rd
- 0 White Rd Unit CV25118907
- 0 White Rd Unit CV24252777
- 0 White Rd Unit CV24252786
- 10444 Mono Rd
- 11930 Baldy Mesa Rd
- 10251 Baldy Mesa Rd
- 10385 Braceo St
- 0 Beaver Unit CV25127667
- 0 Beaver Unit CV25127656
- 0 Beaver Unit CV25127651
- 8760 Del Rosa Rd
- 11498114 De Anza Rd
- 9580 Solano Rd
- 11083 De Anza Rd
- 111 Solana Rd
- 11106 Baldy Mesa Rd
- 11090 De Anza Rd
- 11024 Baldy Mesa Rd
- 11124 Baldy Mesa Rd
- 11046 Baldy Mesa Rd
- 11075 Arrowhead Rd
- 9515 Appleton St
- 11030 De Anza Rd Unit A
- 9722 Solano Rd
- 9558 Appleton St
- 0 0 Calvary Ct Unit 537198
- 0 0 Calvary Ct
- 11057 Arrowhead Rd
- 9764 Solano Rd
- 9733 Calvary Ct
- 9720 Calvary Ct