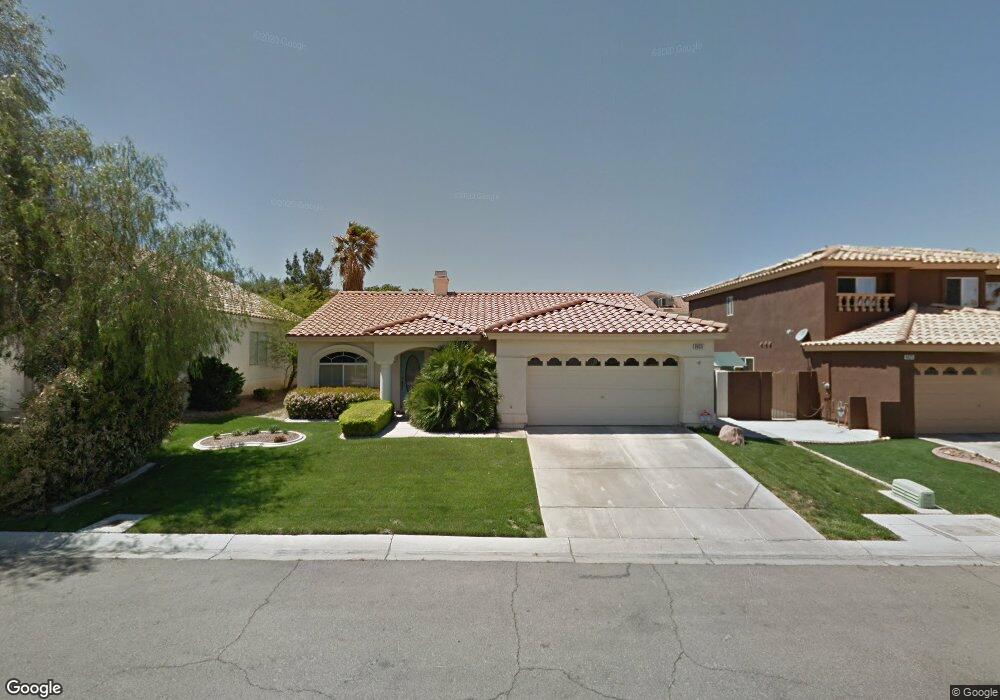
9635 Summer Cypress St Unit 6 Las Vegas, NV 89123
Silverado Ranch NeighborhoodEstimated Value: $468,846 - $526,000
3
Beds
2
Baths
1,617
Sq Ft
$309/Sq Ft
Est. Value
About This Home
This home is located at 9635 Summer Cypress St Unit 6, Las Vegas, NV 89123 and is currently estimated at $500,212, approximately $309 per square foot. 9635 Summer Cypress St Unit 6 is a home located in Clark County with nearby schools including Roberta C Cartwright Elementary School, Charles Silvestri Junior High School, and Silverado High School.
Ownership History
Date
Name
Owned For
Owner Type
Purchase Details
Closed on
Nov 20, 2018
Sold by
Brichacek Janet J
Bought by
Brichacek Janet J and The Benji Revocable Trust
Current Estimated Value
Purchase Details
Closed on
Jan 16, 2002
Sold by
Rocco Patrick A and Rocco Germaine L
Bought by
Brichacek Janet J
Home Financials for this Owner
Home Financials are based on the most recent Mortgage that was taken out on this home.
Original Mortgage
$141,600
Outstanding Balance
$58,317
Interest Rate
7.15%
Estimated Equity
$441,895
Purchase Details
Closed on
Oct 1, 1996
Sold by
American West Homes Inc
Bought by
Rocco Patrick A and Rocco Germaine L
Home Financials for this Owner
Home Financials are based on the most recent Mortgage that was taken out on this home.
Original Mortgage
$125,000
Interest Rate
7.87%
Create a Home Valuation Report for This Property
The Home Valuation Report is an in-depth analysis detailing your home's value as well as a comparison with similar homes in the area
Home Values in the Area
Average Home Value in this Area
Purchase History
| Date | Buyer | Sale Price | Title Company |
|---|---|---|---|
| Brichacek Janet J | -- | None Available | |
| Brichacek Janet J | $177,000 | Fidelity National Title | |
| Rocco Patrick A | $142,000 | First American Title Co |
Source: Public Records
Mortgage History
| Date | Status | Borrower | Loan Amount |
|---|---|---|---|
| Open | Brichacek Janet J | $141,600 | |
| Previous Owner | Rocco Patrick A | $125,000 |
Source: Public Records
Tax History Compared to Growth
Tax History
| Year | Tax Paid | Tax Assessment Tax Assessment Total Assessment is a certain percentage of the fair market value that is determined by local assessors to be the total taxable value of land and additions on the property. | Land | Improvement |
|---|---|---|---|---|
| 2025 | $1,908 | $117,178 | $49,350 | $67,828 |
| 2024 | $1,853 | $117,178 | $49,350 | $67,828 |
| 2023 | $1,853 | $110,765 | $46,200 | $64,565 |
| 2022 | $1,800 | $97,677 | $38,500 | $59,177 |
| 2021 | $1,747 | $88,493 | $32,200 | $56,293 |
| 2020 | $1,693 | $87,297 | $31,500 | $55,797 |
| 2019 | $1,644 | $83,705 | $28,700 | $55,005 |
| 2018 | $1,596 | $77,831 | $24,500 | $53,331 |
| 2017 | $2,309 | $78,737 | $24,500 | $54,237 |
| 2016 | $1,512 | $72,374 | $18,200 | $54,174 |
| 2015 | $1,509 | $60,577 | $12,950 | $47,627 |
| 2014 | $1,465 | $48,447 | $10,500 | $37,947 |
Source: Public Records
Map
Nearby Homes
- 9560 Summerfest St
- 2300 E Silverado Ranch Blvd Unit 2112
- 2300 E Silverado Ranch Blvd Unit 2033
- 2300 E Silverado Ranch Blvd Unit 2161
- 2300 E Silverado Ranch Blvd Unit 1080
- 2300 E Silverado Ranch Blvd Unit 1106
- 2300 E Silverado Ranch Blvd Unit 2196
- 2300 E Silverado Ranch Blvd Unit 2158
- 2300 E Silverado Ranch Blvd Unit 1074
- 2300 E Silverado Ranch Blvd Unit 1180
- 2300 E Silverado Ranch Blvd Unit 2133
- 2300 E Silverado Ranch Blvd Unit 2162
- 2300 E Silverado Ranch Blvd Unit 2040
- 2300 E Silverado Ranch Blvd Unit 1151
- 2300 E Silverado Ranch Blvd Unit 1072
- 9620 Orchid Bay Dr
- 2216 Madica Ave
- 2195 Merano Ct
- 1905 Bocale Ct
- 1846 Autumn Gold Ave
- 9645 Summer Cypress St
- 9625 Summer Cypress St
- 9634 Summer Lilac Ct
- 9624 Summer Lilac Ct
- 9644 Summer Lilac Ct
- 9655 Summer Cypress St
- 9634 Summer Cypress St
- 9654 Summer Lilac Ct
- 9644 Summer Cypress St
- 9624 Summer Cypress St
- 9665 Summer Cypress St
- 9654 Summer Cypress St Unit 6
- 9614 Summer Cypress St Unit 5
- 2142 Gypsy Bell Ave
- 2128 Gypsy Bell Ave
- 9664 Summer Lilac Ct
- 2112 Gypsy Bell Ave
- 9664 Summer Cypress St
- 9675 Summer Cypress St Unit 6
- 9635 Summer Lilac Ct