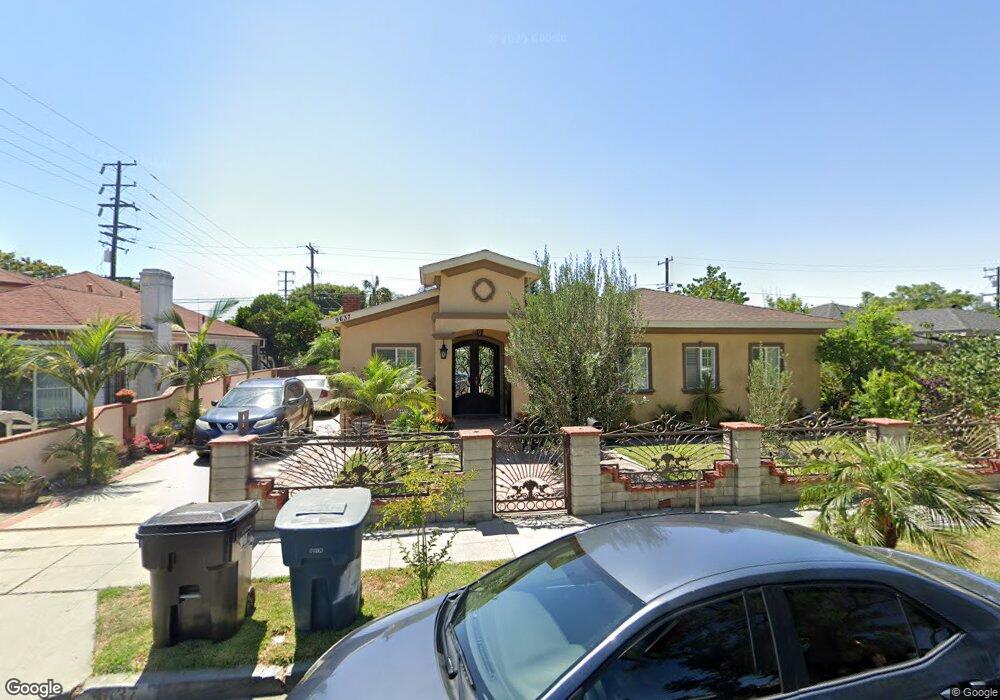
9637 Hunt Ave South Gate, CA 90280
Estimated Value: $718,600 - $790,000
2
Beds
2
Baths
1,484
Sq Ft
$504/Sq Ft
Est. Value
About This Home
This home is located at 9637 Hunt Ave, South Gate, CA 90280 and is currently estimated at $747,650, approximately $503 per square foot. 9637 Hunt Ave is a home located in Los Angeles County with nearby schools including Bryson Avenue Elementary School, South Gate Middle School, and Southeast Middle School.
Ownership History
Date
Name
Owned For
Owner Type
Purchase Details
Closed on
Feb 21, 2009
Sold by
Hernadez Jesus
Bought by
Hernandez Roberto Victoria and Espinoza Lucila
Current Estimated Value
Purchase Details
Closed on
Aug 23, 2001
Sold by
Espinoza Jose
Bought by
Hernandez Jesus and Victoria Hernandez Roberto
Home Financials for this Owner
Home Financials are based on the most recent Mortgage that was taken out on this home.
Original Mortgage
$131,950
Outstanding Balance
$50,876
Interest Rate
6.99%
Estimated Equity
$696,774
Purchase Details
Closed on
Nov 15, 1996
Sold by
Martinez Victor
Bought by
Espinoza Jose and Zendejas Teresa H
Home Financials for this Owner
Home Financials are based on the most recent Mortgage that was taken out on this home.
Original Mortgage
$135,276
Interest Rate
7.67%
Mortgage Type
FHA
Create a Home Valuation Report for This Property
The Home Valuation Report is an in-depth analysis detailing your home's value as well as a comparison with similar homes in the area
Home Values in the Area
Average Home Value in this Area
Purchase History
| Date | Buyer | Sale Price | Title Company |
|---|---|---|---|
| Hernandez Roberto Victoria | -- | None Available | |
| Hernandez Jesus | -- | Fidelity Title | |
| Espinoza Jose | $137,000 | American Title Company |
Source: Public Records
Mortgage History
| Date | Status | Borrower | Loan Amount |
|---|---|---|---|
| Open | Hernandez Jesus | $131,950 | |
| Closed | Espinoza Jose | $135,276 |
Source: Public Records
Tax History Compared to Growth
Tax History
| Year | Tax Paid | Tax Assessment Tax Assessment Total Assessment is a certain percentage of the fair market value that is determined by local assessors to be the total taxable value of land and additions on the property. | Land | Improvement |
|---|---|---|---|---|
| 2025 | $5,439 | $403,673 | $180,411 | $223,262 |
| 2024 | $5,439 | $395,759 | $176,874 | $218,885 |
| 2023 | $5,348 | $388,000 | $173,406 | $214,594 |
| 2022 | $5,101 | $380,393 | $170,006 | $210,387 |
| 2021 | $5,041 | $372,935 | $166,673 | $206,262 |
| 2019 | $4,886 | $361,876 | $161,730 | $200,146 |
| 2018 | $3,449 | $247,455 | $158,559 | $88,896 |
| 2016 | $3,297 | $237,847 | $152,402 | $85,445 |
| 2015 | $3,246 | $234,275 | $150,113 | $84,162 |
| 2014 | $3,250 | $229,687 | $147,173 | $82,514 |
Source: Public Records
Map
Nearby Homes
- 9616 Bowman Ave
- 9525 Bowman Ave
- 9528 Mcnerney Ave
- 9714 Otis St
- 9718 Otis St
- 9219 Alexander Ave
- 9643 Mallison Ave
- 9611 Mallison Ave
- 10307 Alexander Ave
- 9307 San Miguel Ave
- 9529 San Juan Ave
- 10029 San Gabriel Ave
- 5166 Mccallum Ave
- 10240 Atlantic Ave
- 8686 San Juan Ave
- 10891 Standard Ave
- 10016 California Ave
- 10611 San Luis Ave
- 9222 California Ave
- 10406 San Carlos Ave