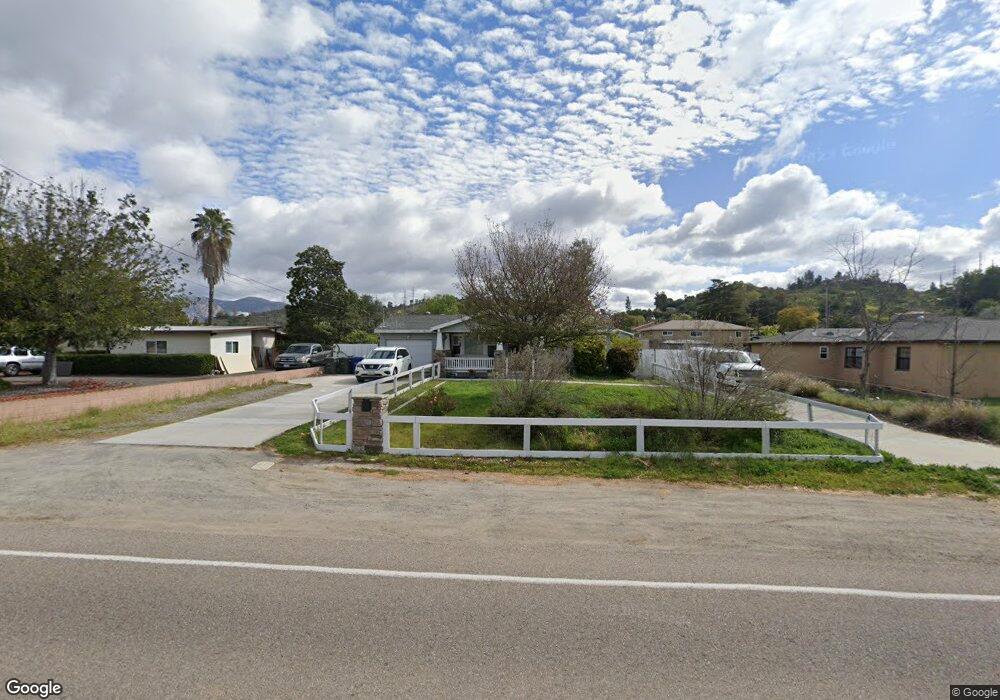
9637 Lakeview Rd Lakeside, CA 92040
Estimated Value: $755,000 - $864,000
4
Beds
3
Baths
1,485
Sq Ft
$539/Sq Ft
Est. Value
About This Home
This home is located at 9637 Lakeview Rd, Lakeside, CA 92040 and is currently estimated at $800,871, approximately $539 per square foot. 9637 Lakeview Rd is a home located in San Diego County with nearby schools including Lakeview Elementary School, Tierra Del Sol Middle School, and El Capitan High School.
Ownership History
Date
Name
Owned For
Owner Type
Purchase Details
Closed on
Apr 27, 2016
Sold by
Powers John J and Powers Sue M
Bought by
The Department Of Veterans Affairs Of Th
Current Estimated Value
Purchase Details
Closed on
Aug 4, 2008
Sold by
Powers John J and Powers Sue M
Bought by
Powers John J and Powers Sue M
Purchase Details
Closed on
Jul 21, 2004
Sold by
Wilcox Gene M and Wilcox Sally
Bought by
Powers John J and Powers Sue M
Home Financials for this Owner
Home Financials are based on the most recent Mortgage that was taken out on this home.
Original Mortgage
$265,000
Interest Rate
5.75%
Mortgage Type
Purchase Money Mortgage
Purchase Details
Closed on
Jul 19, 1996
Sold by
Eisenbarth William M and Eisenbarth Carol A
Bought by
Wilcox Gene M and Wilcox Sally
Home Financials for this Owner
Home Financials are based on the most recent Mortgage that was taken out on this home.
Original Mortgage
$115,900
Interest Rate
8.18%
Purchase Details
Closed on
Nov 8, 1991
Create a Home Valuation Report for This Property
The Home Valuation Report is an in-depth analysis detailing your home's value as well as a comparison with similar homes in the area
Home Values in the Area
Average Home Value in this Area
Purchase History
| Date | Buyer | Sale Price | Title Company |
|---|---|---|---|
| The Department Of Veterans Affairs Of Th | $460,000 | Chicago Title Company Sd | |
| Powers John J | -- | None Available | |
| Powers John J | $415,000 | United Title Company San Die | |
| Wilcox Gene M | $122,000 | American Title Ins Co | |
| -- | $129,000 | -- |
Source: Public Records
Mortgage History
| Date | Status | Borrower | Loan Amount |
|---|---|---|---|
| Previous Owner | Powers John J | $265,000 | |
| Previous Owner | Wilcox Gene M | $115,900 |
Source: Public Records
Tax History Compared to Growth
Tax History
| Year | Tax Paid | Tax Assessment Tax Assessment Total Assessment is a certain percentage of the fair market value that is determined by local assessors to be the total taxable value of land and additions on the property. | Land | Improvement |
|---|---|---|---|---|
| 2025 | $7,023 | $544,538 | $277,714 | $266,824 |
| 2024 | $7,023 | $533,862 | $272,269 | $261,593 |
| 2023 | $6,763 | $523,395 | $266,931 | $256,464 |
| 2022 | $6,637 | $513,134 | $261,698 | $251,436 |
| 2021 | $6,548 | $503,073 | $256,567 | $246,506 |
| 2020 | $6,438 | $497,916 | $253,937 | $243,979 |
| 2019 | $6,317 | $488,154 | $248,958 | $239,196 |
| 2018 | $6,196 | $478,583 | $244,077 | $234,506 |
| 2017 | $820 | $469,200 | $239,292 | $229,908 |
| 2016 | $5,247 | $400,000 | $204,000 | $196,000 |
| 2015 | $5,047 | $380,000 | $194,000 | $186,000 |
| 2014 | $4,547 | $350,000 | $179,000 | $171,000 |
Source: Public Records
Map
Nearby Homes
- 13045 Shenandoah Dr
- 9518 Cypress St
- 12886 Castle Court Dr
- 13135 Pam Ln
- 10019 Tamil Rd
- 9903 Lindo Lake Place
- 10025 Tamil Rd
- 12721 Julian Ave
- 12741 Laurel St
- 12741 Laurel St Unit 29
- 12923 Mapleview St Unit 8
- 12923 Mapleview St Unit 6
- 12643 Castle Court Dr
- 12650 Lakeshore Dr Unit 113
- 12650 Lakeshore Dr
- 12740 Casa Vista Rd
- 12710 Laurel St Unit 113
- 12621 Lindo Ln
- 12750 Laurel St Unit 504
- 9620 Los Coches Rd
- 13412 Sunny Ln
- 9641 Lakeview Rd
- 13426 Sunny Ln
- 9655 Lakeview Rd
- 9617 Lakeview Rd
- 13436 Sunny Ln
- 13417 Sunny Ln
- 9630 Lakeview Rd
- 13423 Julian Ave
- 9646 Lakeview Rd
- 13413 Julian Ave
- 9652 Lakeview Rd
- 13335 Julian Ave
- 9622 Lakeview Rd
- 13429 Sunny Ln
- 13431 Julian Ave
- 13446 Sunny Ln
- 9609 Lakeview Rd
- 9614 Lakeview Rd
- 13437 Sunny Ln