Estimated Value: $472,766 - $575,000
Studio
2
Baths
1,867
Sq Ft
$278/Sq Ft
Est. Value
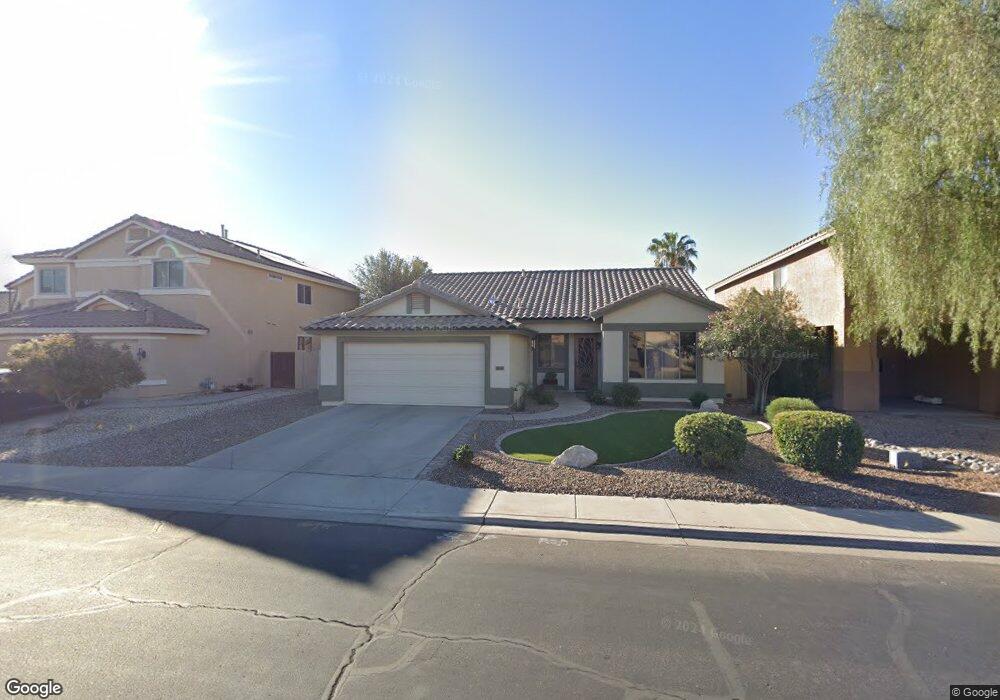
About This Home
This home is located at 9639 E Nido Ave, Mesa, AZ 85209 and is currently estimated at $518,442, approximately $277 per square foot. 9639 E Nido Ave is a home located in Maricopa County with nearby schools including Augusta Ranch Elementary School, Desert Ridge Jr. High School, and Desert Ridge High School.
Ownership History
Date
Name
Owned For
Owner Type
Purchase Details
Closed on
Dec 30, 2019
Sold by
Bartley Joan M
Bought by
Bartley Joan M and Joan M Bartley Trust
Current Estimated Value
Purchase Details
Closed on
Sep 21, 2005
Sold by
Wetzel Brynann J and Wilcoxen Brynann J
Bought by
Bartley Carl J and Bartley Joan M
Home Financials for this Owner
Home Financials are based on the most recent Mortgage that was taken out on this home.
Original Mortgage
$256,900
Outstanding Balance
$136,317
Interest Rate
5.72%
Mortgage Type
Fannie Mae Freddie Mac
Estimated Equity
$382,125
Purchase Details
Closed on
Mar 28, 2002
Sold by
Fjeld Richard A and Fjeld Pamela J
Bought by
Wilcoxen Brynann J
Home Financials for this Owner
Home Financials are based on the most recent Mortgage that was taken out on this home.
Original Mortgage
$134,152
Interest Rate
5.25%
Mortgage Type
New Conventional
Purchase Details
Closed on
Dec 5, 2000
Sold by
U S Home Corp
Bought by
Fjeld Richard A and Fjeld Pamela J
Create a Home Valuation Report for This Property
The Home Valuation Report is an in-depth analysis detailing your home's value as well as a comparison with similar homes in the area
Purchase History
| Date | Buyer | Sale Price | Title Company |
|---|---|---|---|
| Bartley Joan M | -- | None Available | |
| Bartley Joan M | -- | None Available | |
| Bartley Carl J | $331,900 | Chicago Title Insurance Co | |
| Wilcoxen Brynann J | $167,900 | First American Title Ins Co | |
| Fjeld Richard A | $142,025 | North American Title |
Source: Public Records
Mortgage History
| Date | Status | Borrower | Loan Amount |
|---|---|---|---|
| Open | Bartley Carl J | $256,900 | |
| Previous Owner | Wilcoxen Brynann J | $134,152 | |
| Closed | Wilcoxen Brynann J | $16,620 |
Source: Public Records
Tax History
| Year | Tax Paid | Tax Assessment Tax Assessment Total Assessment is a certain percentage of the fair market value that is determined by local assessors to be the total taxable value of land and additions on the property. | Land | Improvement |
|---|---|---|---|---|
| 2025 | $1,899 | $25,643 | -- | -- |
| 2024 | $1,843 | $24,422 | -- | -- |
| 2023 | $1,843 | $37,980 | $7,590 | $30,390 |
| 2022 | $1,798 | $29,310 | $5,860 | $23,450 |
| 2021 | $1,947 | $28,070 | $5,610 | $22,460 |
| 2020 | $1,914 | $25,820 | $5,160 | $20,660 |
| 2019 | $1,773 | $23,650 | $4,730 | $18,920 |
| 2018 | $1,688 | $22,280 | $4,450 | $17,830 |
| 2017 | $1,635 | $21,300 | $4,260 | $17,040 |
| 2016 | $1,696 | $20,630 | $4,120 | $16,510 |
| 2015 | $1,555 | $20,460 | $4,090 | $16,370 |
Source: Public Records
Map
Nearby Homes
- 9628 E Monte Ave
- 9812 E Monterey Ave
- 2642 S Joplin
- 9719 E Navarro Ave
- 9904 E Monterey Ave
- 9831 E Lompoc Ave
- 9637 E Olla Ave
- 9348 E Milagro Ave
- 2415 S Compton
- 9311 E Milagro Ave
- 9628 E Lindner Ave
- 9904 E Keats Ave
- 9233 E Neville Ave Unit 1131
- 9233 E Neville Ave Unit 1136
- 9233 E Neville Ave Unit 1061
- 9233 E Neville Ave Unit 1154
- 9534 E Keats Ave
- 9728 E Kiva Ave
- 9339 E Lompoc Ave
- 2024 S Baldwin Unit 114
- 9633 E Nido Ave
- 9645 E Nido Ave
- 9627 E Nido Ave
- 9649 E Nido Ave
- 9640 E Nido Ave
- 9646 E Nido Ave
- 9634 E Nido Ave
- 9653 E Nido Ave
- 9621 E Nido Ave
- 9650 E Nido Ave
- 9615 E Nido Ave
- 9654 E Nido Ave
- 9622 E Nido Ave
- 9659 E Nido Ave
- 2565 S Warren
- 9616 E Nido Ave
- 9658 E Nido Ave
- 9609 E Nido Ave
- 2561 S Warren
- 9623 E Monterey Ave
Your Personal Tour Guide
Ask me questions while you tour the home.