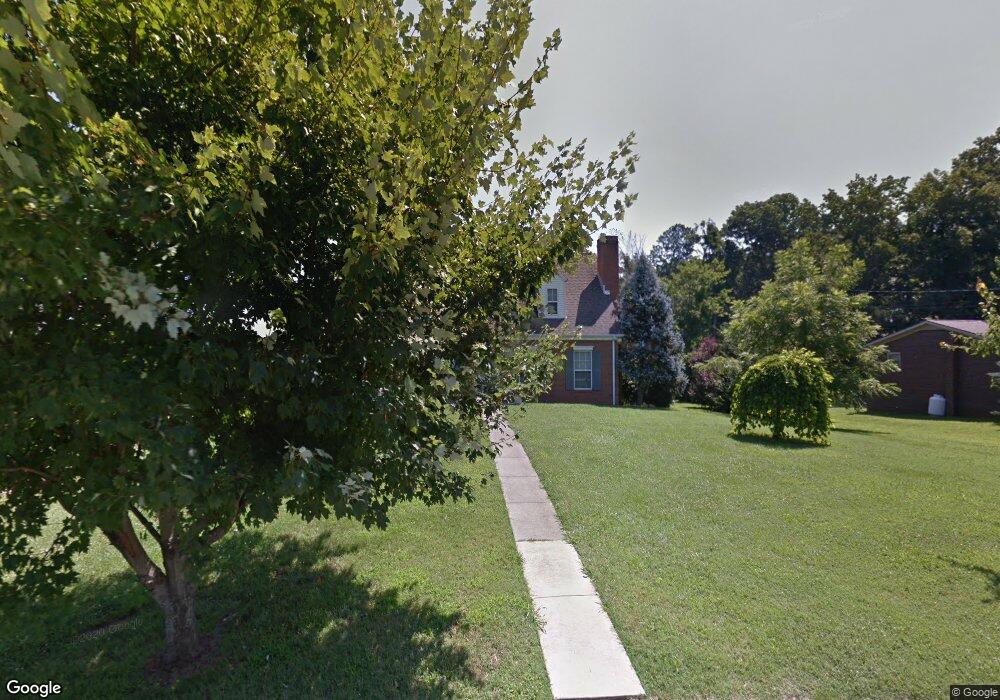
964 Fulton Rd Morristown, TN 37814
Estimated Value: $269,478 - $366,000
--
Bed
2
Baths
2,436
Sq Ft
$126/Sq Ft
Est. Value
About This Home
This home is located at 964 Fulton Rd, Morristown, TN 37814 and is currently estimated at $307,870, approximately $126 per square foot. 964 Fulton Rd is a home located in Hamblen County with nearby schools including John Hay Elementary School, Meadowview Middle School, and Morristown East High School.
Ownership History
Date
Name
Owned For
Owner Type
Purchase Details
Closed on
May 30, 2017
Bought by
Anglea Larry W
Current Estimated Value
Home Financials for this Owner
Home Financials are based on the most recent Mortgage that was taken out on this home.
Original Mortgage
$114,750
Outstanding Balance
$95,265
Interest Rate
3.95%
Estimated Equity
$212,605
Purchase Details
Closed on
Jan 29, 2007
Bought by
City Of Morristown
Purchase Details
Closed on
Apr 1, 2002
Sold by
Johnny Greene
Bought by
Cross Brad
Home Financials for this Owner
Home Financials are based on the most recent Mortgage that was taken out on this home.
Original Mortgage
$84,800
Interest Rate
6.8%
Purchase Details
Closed on
Mar 18, 1994
Bought by
Greene Johnny M and Greene Rebecca N
Purchase Details
Closed on
Nov 7, 1985
Bought by
Greene Billy R and Greene Georgia M
Purchase Details
Closed on
Jan 1, 1985
Purchase Details
Closed on
Jun 30, 1984
Bought by
Greene Billy R and Greene Georgia M
Create a Home Valuation Report for This Property
The Home Valuation Report is an in-depth analysis detailing your home's value as well as a comparison with similar homes in the area
Home Values in the Area
Average Home Value in this Area
Purchase History
| Date | Buyer | Sale Price | Title Company |
|---|---|---|---|
| Anglea Larry W | -- | -- | |
| City Of Morristown | -- | -- | |
| Cross Brad | $175,000 | -- | |
| Greene Johnny M | $5,000 | -- | |
| Greene Billy R | $27,500 | -- | |
| -- | $30,000 | -- | |
| Greene Billy R | -- | -- |
Source: Public Records
Mortgage History
| Date | Status | Borrower | Loan Amount |
|---|---|---|---|
| Open | Greene Billy R | $114,750 | |
| Closed | Greene Billy R | -- | |
| Previous Owner | Greene Billy R | $84,800 |
Source: Public Records
Tax History Compared to Growth
Tax History
| Year | Tax Paid | Tax Assessment Tax Assessment Total Assessment is a certain percentage of the fair market value that is determined by local assessors to be the total taxable value of land and additions on the property. | Land | Improvement |
|---|---|---|---|---|
| 2024 | $675 | $38,375 | $4,000 | $34,375 |
| 2023 | $675 | $38,375 | $0 | $0 |
| 2022 | $1,212 | $38,375 | $4,000 | $34,375 |
| 2021 | $1,212 | $38,375 | $4,000 | $34,375 |
| 2020 | $1,211 | $38,375 | $4,000 | $34,375 |
| 2019 | $1,186 | $34,875 | $4,000 | $30,875 |
| 2018 | $1,099 | $34,875 | $4,000 | $30,875 |
| 2017 | $1,082 | $34,875 | $4,000 | $30,875 |
| 2016 | $1,033 | $34,875 | $4,000 | $30,875 |
| 2015 | $960 | $34,875 | $4,000 | $30,875 |
| 2014 | -- | $34,875 | $4,000 | $30,875 |
| 2013 | -- | $36,850 | $0 | $0 |
Source: Public Records
Map
Nearby Homes
- 2405 Southern Dr
- 2320 Southern Dr
- 1250 N Liberty Hill Rd
- 0 Morelock Rd N
- 1250 N Liberty Hill Dr
- Lot 2 Morelock Rd
- 1643 Meadowview Ln
- 2035 Reese St
- 1635 Meadowview Ln
- 1683 Pebblestone Ct
- 345 Belle Meade Cir
- 1864 Limestone Path
- 2998 Nicole Cir
- 2909 Nicole Cir
- 3004 Nicole Cir
- 512 Cliff St
- 3003 Eloise Dr
- 3113 Berna Way
- 517 Cliff St
- 1961 Brights View Ln
- 936 Fulton Rd
- 933 Fulton Rd
- 1103 Piedmont Cir
- 1100 Piedmont Cir
- 1105 Piedmont Cir
- 888 Fulton Rd
- 1102 Piedmont Cir
- 941 Fulton Rd
- 2404 Southern Dr
- 2408 Southern Dr
- 1106 Piedmont Cir
- 891 Fulton Rd
- 2400 Southern Dr
- 2332 Southern Dr
- 970 Fulton Rd
- 1110 Piedmont Cir
- 826 Fulton Rd
- 1114 Piedmont Cir
- 2409 Southern Dr
- 2401 Southern Dr