964 Summer St Lynnfield, MA 01940
Estimated Value: $963,000 - $1,097,000
3
Beds
4
Baths
3,375
Sq Ft
$299/Sq Ft
Est. Value
About This Home
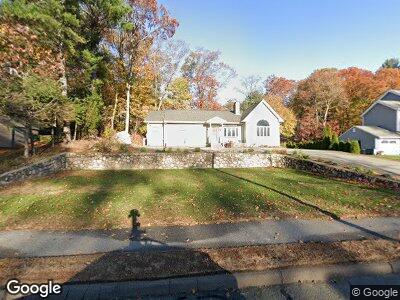
This home is located at 964 Summer St, Lynnfield, MA 01940 and is currently estimated at $1,010,215, approximately $299 per square foot. 964 Summer St is a home located in Essex County with nearby schools including Pickering Middle School, Lynnfield High School, and Our Lady Of Assumption School.
Ownership History
Date
Name
Owned For
Owner Type
Purchase Details
Closed on
Oct 27, 1993
Sold by
Eastern B & T and Goldman Martin C
Bought by
Frazier Barbara
Current Estimated Value
Home Financials for this Owner
Home Financials are based on the most recent Mortgage that was taken out on this home.
Original Mortgage
$104,500
Interest Rate
6.86%
Mortgage Type
Purchase Money Mortgage
Create a Home Valuation Report for This Property
The Home Valuation Report is an in-depth analysis detailing your home's value as well as a comparison with similar homes in the area
Home Values in the Area
Average Home Value in this Area
Purchase History
| Date | Buyer | Sale Price | Title Company |
|---|---|---|---|
| Frazier Barbara | $154,500 | -- |
Source: Public Records
Mortgage History
| Date | Status | Borrower | Loan Amount |
|---|---|---|---|
| Open | Frazier Barbara | $355,000 | |
| Closed | Frazier Barbara | $357,000 | |
| Closed | Frazier Barbara | $358,000 | |
| Closed | Frazier Barbara | $360,000 | |
| Closed | Frazier Barbara | $360,000 | |
| Closed | Frazier Barbara | $365,000 | |
| Closed | Frazier Barbara | $200,000 | |
| Closed | Frazier Barbara | $100,000 | |
| Closed | Frazier Barbara | $104,500 |
Source: Public Records
Tax History Compared to Growth
Tax History
| Year | Tax Paid | Tax Assessment Tax Assessment Total Assessment is a certain percentage of the fair market value that is determined by local assessors to be the total taxable value of land and additions on the property. | Land | Improvement |
|---|---|---|---|---|
| 2025 | $9,021 | $854,300 | $486,900 | $367,400 |
| 2024 | $8,162 | $776,600 | $442,600 | $334,000 |
| 2023 | $8,202 | $725,800 | $419,900 | $305,900 |
| 2022 | $7,735 | $645,100 | $384,900 | $260,200 |
| 2021 | $7,819 | $589,200 | $341,200 | $248,000 |
| 2020 | $7,325 | $526,200 | $278,200 | $248,000 |
| 2019 | $7,100 | $510,400 | $262,400 | $248,000 |
| 2018 | $6,870 | $499,300 | $262,400 | $236,900 |
| 2017 | $6,880 | $499,300 | $262,400 | $236,900 |
| 2016 | $6,850 | $472,400 | $250,200 | $222,200 |
| 2015 | $6,373 | $439,800 | $227,400 | $212,400 |
Source: Public Records
Map
Nearby Homes
- 8 Longbow Cir
- 37 Locksley Rd
- 33 Rockwood Rd
- 344 Broadway
- 16 Lakeview Dr
- 325 Walnut St
- 11 Williams Rd
- 21 Wildewood Dr
- 567 Summer St
- 24 Wildewood Dr
- 6 Fall Way
- 37 Locust St
- 48 Pillings Pond Rd
- 16 Bluejay Rd
- 4603 Deerfield Cir
- 9 Broadway Unit 304
- 28 Highland Ave
- 18 Walton St
- 1100 Salem St Unit 41
- 1100 Salem St Unit 46