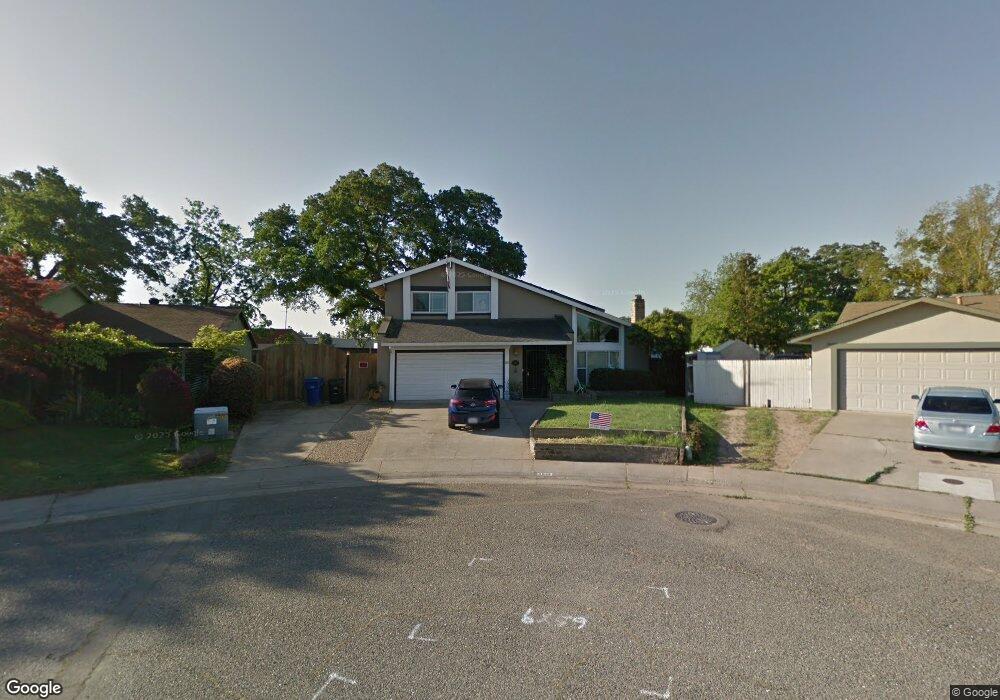
9644 Elmira Cir Sacramento, CA 95827
Larchmont Riviera East NeighborhoodEstimated Value: $386,000 - $605,000
4
Beds
3
Baths
1,845
Sq Ft
$289/Sq Ft
Est. Value
About This Home
This home is located at 9644 Elmira Cir, Sacramento, CA 95827 and is currently estimated at $533,828, approximately $289 per square foot. 9644 Elmira Cir is a home located in Sacramento County with nearby schools including Cordova Gardens Elementary School, Mills Middle School, and Cordova High School.
Ownership History
Date
Name
Owned For
Owner Type
Purchase Details
Closed on
Oct 15, 2020
Sold by
Frank Paul D and Lee Frank Pamela
Bought by
Frank Paul D and Lee Frank Pamela
Current Estimated Value
Home Financials for this Owner
Home Financials are based on the most recent Mortgage that was taken out on this home.
Original Mortgage
$240,000
Outstanding Balance
$213,078
Interest Rate
2.8%
Mortgage Type
New Conventional
Estimated Equity
$320,750
Purchase Details
Closed on
Dec 19, 2003
Sold by
Frank Paul D and Frank Paul
Bought by
Rank Paul D and Lee Frank Pamela K
Home Financials for this Owner
Home Financials are based on the most recent Mortgage that was taken out on this home.
Original Mortgage
$190,500
Interest Rate
5.97%
Mortgage Type
New Conventional
Purchase Details
Closed on
Sep 7, 2000
Sold by
Bourland Pamela Jean
Bought by
Frank Paul
Home Financials for this Owner
Home Financials are based on the most recent Mortgage that was taken out on this home.
Original Mortgage
$156,703
Interest Rate
8.11%
Mortgage Type
FHA
Create a Home Valuation Report for This Property
The Home Valuation Report is an in-depth analysis detailing your home's value as well as a comparison with similar homes in the area
Home Values in the Area
Average Home Value in this Area
Purchase History
| Date | Buyer | Sale Price | Title Company |
|---|---|---|---|
| Frank Paul D | -- | Old Republic Title Company | |
| Rank Paul D | -- | -- | |
| Frank Paul | $158,000 | Fidelity National Title Co |
Source: Public Records
Mortgage History
| Date | Status | Borrower | Loan Amount |
|---|---|---|---|
| Open | Frank Paul D | $240,000 | |
| Closed | Rank Paul D | $190,500 | |
| Closed | Frank Paul | $156,703 |
Source: Public Records
Tax History Compared to Growth
Tax History
| Year | Tax Paid | Tax Assessment Tax Assessment Total Assessment is a certain percentage of the fair market value that is determined by local assessors to be the total taxable value of land and additions on the property. | Land | Improvement |
|---|---|---|---|---|
| 2025 | $2,907 | $237,678 | $72,315 | $165,363 |
| 2024 | $2,907 | $233,019 | $70,898 | $162,121 |
| 2023 | $2,850 | $228,451 | $69,508 | $158,943 |
| 2022 | $2,814 | $223,973 | $68,146 | $155,827 |
| 2021 | $2,761 | $219,582 | $66,810 | $152,772 |
| 2020 | $2,660 | $217,331 | $66,125 | $151,206 |
| 2019 | $2,617 | $213,071 | $64,829 | $148,242 |
| 2018 | $2,549 | $208,894 | $63,558 | $145,336 |
| 2017 | $2,486 | $204,799 | $62,312 | $142,487 |
| 2016 | $2,433 | $200,785 | $61,091 | $139,694 |
| 2015 | $2,313 | $197,770 | $60,174 | $137,596 |
| 2014 | $2,457 | $193,897 | $58,996 | $134,901 |
Source: Public Records
Map
Nearby Homes
- 9648 Linda Rio Dr
- 2608 Kansas Way
- 2876 Londonderry Dr
- 9730 Mira Del Rio Dr
- 9374 Deeth Ct
- 9728 Greensboro Cir
- 9801 Mira Del Rio Dr
- 9815 Mira Del Rio Dr
- 9825 Winterwood Way
- 2579 Rio Bravo Cir
- 3581 Parc Villa Cir
- 3589 Parc Villa Cir
- 3593 Parc Villa Cir
- 3529 Granby Dr
- 3605 Parc Villa Cir
- 3123 Tenwoods Ct
- 3604 Granby Dr
- 3616 Parc Villa Cir
- 3616 Parc Villa Rd
- 1684SCV 1684 Plan at Stone Creek Village - Veranda
- 9648 Elmira Cir
- 9640 Elmira Cir
- 9652 Elmira Cir
- 9636 Elmira Cir
- 9651 Elmira Cir
- 9520 Appalachian Dr
- 9632 Elmira Cir
- 9656 Elmira Cir
- 9524 Appalachian Dr
- 9528 Appalachian Dr
- 9655 Elmira Cir
- 9516 Appalachian Dr
- 9628 Elmira Cir
- 9532 Appalachian Dr
- 9660 Elmira Cir
- 9627 Elmira Cir
- 9555 Folsom Blvd Unit D
- 9555 Folsom Blvd
- 9659 Elmira Cir
- 9624 Elmira Cir