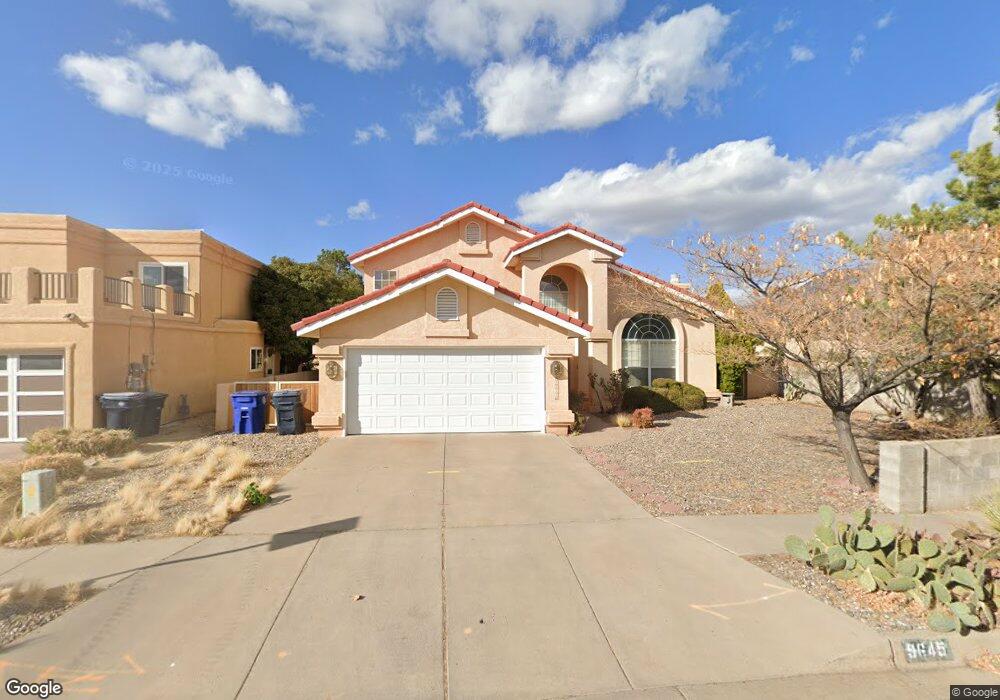
9645 Seligman Ave NE Albuquerque, NM 87109
Heritage East NeighborhoodEstimated Value: $557,000 - $619,000
4
Beds
3
Baths
2,600
Sq Ft
$224/Sq Ft
Est. Value
About This Home
This home is located at 9645 Seligman Ave NE, Albuquerque, NM 87109 and is currently estimated at $582,465, approximately $224 per square foot. 9645 Seligman Ave NE is a home located in Bernalillo County with nearby schools including Hubert H. Humphrey Elementary School, Eisenhower Middle School, and La Cueva High School.
Ownership History
Date
Name
Owned For
Owner Type
Purchase Details
Closed on
Jul 16, 2010
Sold by
Hulsbos David and Hulsbos Mary
Bought by
Duan Huaiyu and Dai Lili
Current Estimated Value
Home Financials for this Owner
Home Financials are based on the most recent Mortgage that was taken out on this home.
Original Mortgage
$257,600
Outstanding Balance
$171,027
Interest Rate
4.78%
Mortgage Type
New Conventional
Estimated Equity
$411,438
Purchase Details
Closed on
Sep 5, 2000
Sold by
Stamper Steaven A and Stamper Betty L
Bought by
Hulsbos David and Hulsbos Mary
Home Financials for this Owner
Home Financials are based on the most recent Mortgage that was taken out on this home.
Original Mortgage
$185,000
Interest Rate
8.16%
Purchase Details
Closed on
Oct 12, 1998
Sold by
Aiken Samuel N and Aiken Donna J
Bought by
Stamper Steaven A and Stamper Betty L
Home Financials for this Owner
Home Financials are based on the most recent Mortgage that was taken out on this home.
Original Mortgage
$195,500
Interest Rate
6.81%
Create a Home Valuation Report for This Property
The Home Valuation Report is an in-depth analysis detailing your home's value as well as a comparison with similar homes in the area
Home Values in the Area
Average Home Value in this Area
Purchase History
| Date | Buyer | Sale Price | Title Company |
|---|---|---|---|
| Duan Huaiyu | -- | Commonwealth Lawyers Title C | |
| Hulsbos David | -- | Fidelity National Title Co | |
| Stamper Steaven A | -- | Rio Grande Title Company Inc |
Source: Public Records
Mortgage History
| Date | Status | Borrower | Loan Amount |
|---|---|---|---|
| Open | Duan Huaiyu | $257,600 | |
| Previous Owner | Hulsbos David | $185,000 | |
| Previous Owner | Stamper Steaven A | $195,500 |
Source: Public Records
Tax History Compared to Growth
Tax History
| Year | Tax Paid | Tax Assessment Tax Assessment Total Assessment is a certain percentage of the fair market value that is determined by local assessors to be the total taxable value of land and additions on the property. | Land | Improvement |
|---|---|---|---|---|
| 2025 | $5,005 | $124,252 | $21,409 | $102,843 |
| 2024 | $5,005 | $120,633 | $20,786 | $99,847 |
| 2023 | $4,919 | $117,120 | $20,181 | $96,939 |
| 2022 | $4,751 | $113,709 | $19,593 | $94,116 |
| 2021 | $4,589 | $110,397 | $19,022 | $91,375 |
| 2020 | $4,512 | $107,181 | $18,468 | $88,713 |
| 2019 | $4,377 | $104,061 | $17,931 | $86,130 |
| 2018 | $4,218 | $104,061 | $17,931 | $86,130 |
| 2017 | $4,086 | $101,030 | $17,409 | $83,621 |
| 2016 | $3,967 | $95,231 | $16,410 | $78,821 |
| 2015 | $92,458 | $92,458 | $15,932 | $76,526 |
| 2014 | $3,841 | $92,458 | $15,932 | $76,526 |
| 2013 | -- | $90,246 | $17,901 | $72,345 |
Source: Public Records
Map
Nearby Homes
- 9612 Seligman Ave NE
- 9616 Peralta Rd NE
- 9604 Peralta Rd NE
- 9516 San Rafael Ave NE
- 9505 Giddings Ave NE
- 7416 Don Tomas Ln NE
- 9129 Dempsey Dr NE
- 9612 Rosas Ave NE
- 0 Del Rey Ave NE Unit 1084354
- 9912 Alexandria Rd NE
- 9705 Blue Dove Place NE
- 0 Palomas Ave NE Unit 1090779
- 0 Palomas Ave NE Unit 1090778
- 9517 Seabrook Dr NE
- 9719 Blue Dove Place NE
- 9727 Blue Dove Place NE
- 9727 Blue Dove NE
- 9834 Desert Lark Place NE Unit 33
- 7401 Volunteer St NE
- 8900 San Francisco Rd NE
- 9641 Seligman Ave NE
- 9648 Messervy Ave NE
- 9637 Seligman Ave NE
- 9644 Messervy Ave NE
- 9644 Seligman Ave NE
- 9640 Seligman Ave NE
- 9601 Coronado Ave NE
- 9636 Seligman Ave NE
- 9633 Seligman Ave NE
- 9600 San Francisco Rd NE
- 9636 Messervy Ave NE
- 9632 Seligman Ave NE
- 9629 Seligman Ave NE
- 9649 Messervy Ave NE
- 9645 Messervy Ave NE
- 9632 Messervy Ave NE
- 9628 Seligman Ave NE
- 9641 Messervy Ave NE
- 9620 San Francisco Rd NE
- 7416 Don Diego St NE