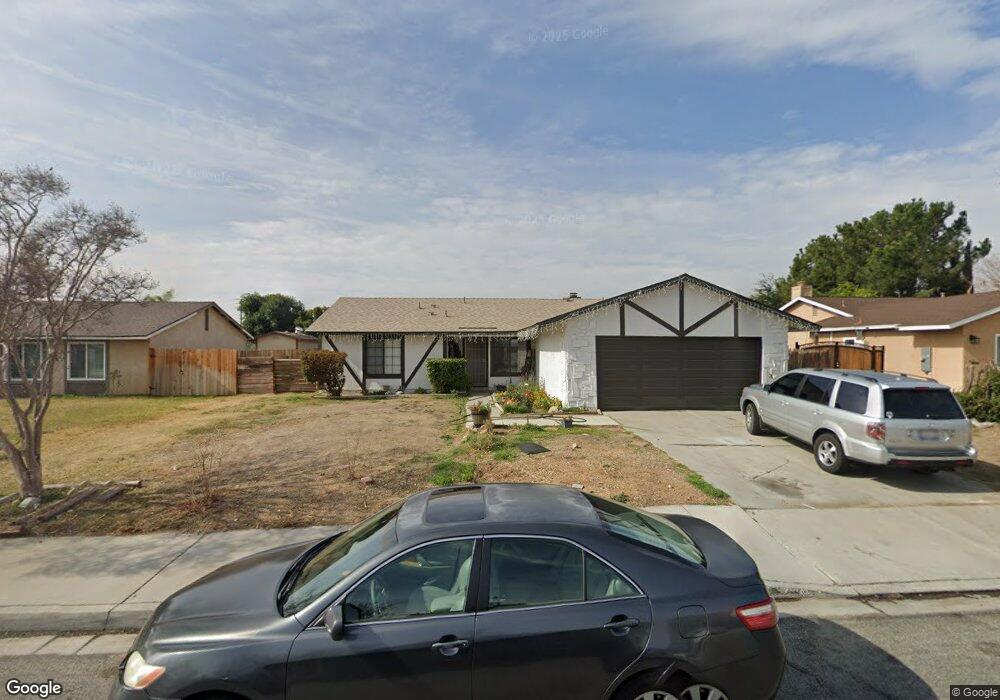
9648 Magnolia St Bloomington, CA 92316
Estimated Value: $521,201 - $589,000
3
Beds
2
Baths
1,125
Sq Ft
$490/Sq Ft
Est. Value
About This Home
This home is located at 9648 Magnolia St, Bloomington, CA 92316 and is currently estimated at $551,050, approximately $489 per square foot. 9648 Magnolia St is a home located in San Bernardino County with nearby schools including Gerald A. Smith Elementary School, Joe Baca, and Bloomington High School.
Ownership History
Date
Name
Owned For
Owner Type
Purchase Details
Closed on
Mar 1, 2005
Sold by
Jimenez Claudia
Bought by
Jimenez Mauricio and Jimenez Claudia
Current Estimated Value
Purchase Details
Closed on
Nov 8, 2004
Sold by
Jimenez Claudia and Velasquez Claudia
Bought by
Jimenez Claudia
Home Financials for this Owner
Home Financials are based on the most recent Mortgage that was taken out on this home.
Original Mortgage
$133,500
Interest Rate
5.79%
Mortgage Type
Purchase Money Mortgage
Purchase Details
Closed on
Nov 2, 2004
Sold by
Jimenez Mauricio
Bought by
Jimenez Claudia
Home Financials for this Owner
Home Financials are based on the most recent Mortgage that was taken out on this home.
Original Mortgage
$133,500
Interest Rate
5.79%
Mortgage Type
Purchase Money Mortgage
Purchase Details
Closed on
May 30, 1995
Sold by
Velasquez Cline
Bought by
Velasquez Claudia
Create a Home Valuation Report for This Property
The Home Valuation Report is an in-depth analysis detailing your home's value as well as a comparison with similar homes in the area
Home Values in the Area
Average Home Value in this Area
Purchase History
| Date | Buyer | Sale Price | Title Company |
|---|---|---|---|
| Jimenez Mauricio | -- | -- | |
| Jimenez Claudia | -- | Orange Coast Title Company | |
| Jimenez Claudia | -- | Orange Coast Title Company | |
| Velasquez Claudia | -- | -- |
Source: Public Records
Mortgage History
| Date | Status | Borrower | Loan Amount |
|---|---|---|---|
| Closed | Jimenez Claudia | $133,500 | |
| Closed | Jimenez Claudia | $133,500 |
Source: Public Records
Tax History Compared to Growth
Tax History
| Year | Tax Paid | Tax Assessment Tax Assessment Total Assessment is a certain percentage of the fair market value that is determined by local assessors to be the total taxable value of land and additions on the property. | Land | Improvement |
|---|---|---|---|---|
| 2025 | $2,543 | $194,173 | $48,542 | $145,631 |
| 2024 | $2,543 | $190,365 | $47,590 | $142,775 |
| 2023 | $2,544 | $186,632 | $46,657 | $139,975 |
| 2022 | $2,619 | $182,972 | $45,742 | $137,230 |
| 2021 | $2,548 | $179,384 | $44,845 | $134,539 |
| 2020 | $2,554 | $177,544 | $44,385 | $133,159 |
| 2019 | $2,490 | $174,063 | $43,515 | $130,548 |
| 2018 | $2,296 | $170,650 | $42,662 | $127,988 |
| 2017 | $2,217 | $167,303 | $41,825 | $125,478 |
| 2016 | $2,272 | $164,023 | $41,005 | $123,018 |
| 2015 | $2,201 | $161,559 | $40,389 | $121,170 |
| 2014 | $2,121 | $158,394 | $39,598 | $118,796 |
Source: Public Records
Map
Nearby Homes
- 9971 Cedar Ave
- 1228 W Woodcrest St
- 9824 Linden Ave
- 9967 Cedar Ave
- 18325 El Molino St
- 1028 W Woodcrest St
- 806 S Sandalwood Ave
- 1154 S Spruce Ave
- 9562 Locust Ave
- 1459 W James St
- 1560 W Athol St
- 18264 Pine Ave Unit a & B
- 18264 Pine Ave
- 10022 Alameda Ave
- 778 Bloomington Ave
- 9649 Grace St
- 18042 Marygold Ave
- 1157 W Orchard St
- 10134 Cedar Place
- 9050 Dumond Dr
- 9636 Magnolia St
- 9660 Magnolia St
- 9624 Magnolia St
- 9672 Magnolia St
- 9639 Magnolia St
- 9627 Magnolia St
- 9651 Magnolia St
- 9612 Magnolia St
- 9615 Magnolia St
- 9684 Magnolia St
- 9665 Magnolia St
- 9603 Magnolia St
- 9596 Magnolia St
- 9677 Magnolia St
- 9640 Wisteria Ct
- 9626 Wisteria Ct
- 9652 Wisteria Ct
- 9652 Wisteria St
- 9696 Magnolia St
- 9614 Wisteria Ct