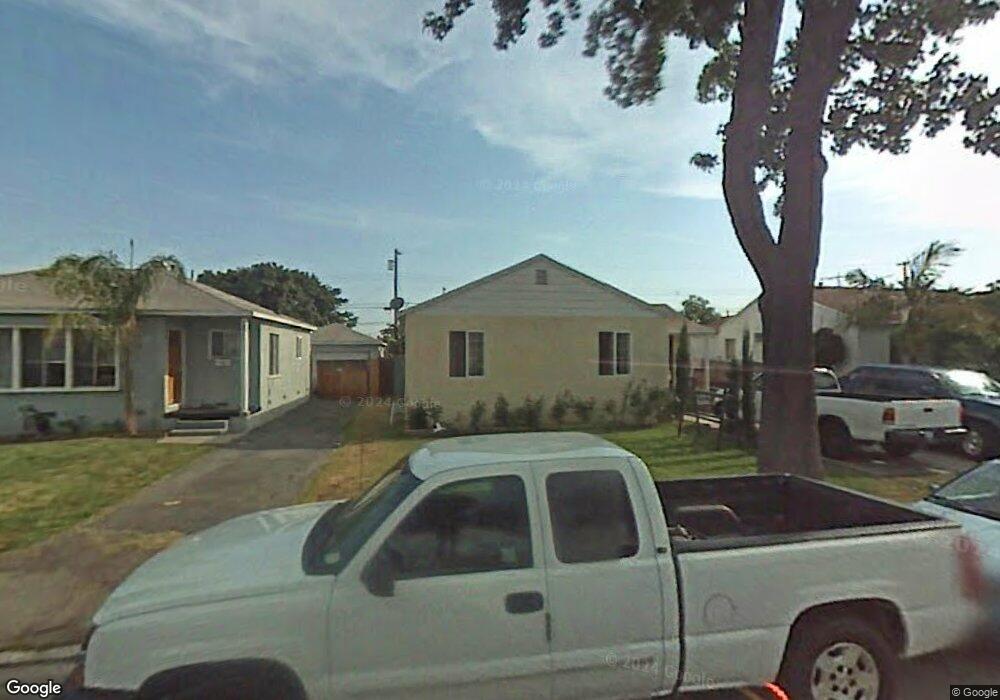
9648 Planter St Pico Rivera, CA 90660
Estimated Value: $695,000 - $751,522
3
Beds
1
Bath
1,490
Sq Ft
$491/Sq Ft
Est. Value
About This Home
This home is located at 9648 Planter St, Pico Rivera, CA 90660 and is currently estimated at $731,881, approximately $491 per square foot. 9648 Planter St is a home located in Los Angeles County with nearby schools including Birney Tech Academy, The STEAM Academy @ Burke, and El Rancho High School.
Ownership History
Date
Name
Owned For
Owner Type
Purchase Details
Closed on
May 19, 2012
Sold by
Sanchez Frances and Rojas Yolanda
Bought by
Rojas Yolanda and Cortez John
Current Estimated Value
Purchase Details
Closed on
Mar 24, 2010
Sold by
Centeno Israel
Bought by
Trejo John M
Home Financials for this Owner
Home Financials are based on the most recent Mortgage that was taken out on this home.
Original Mortgage
$250,381
Outstanding Balance
$168,171
Interest Rate
5.25%
Mortgage Type
FHA
Estimated Equity
$563,710
Purchase Details
Closed on
Sep 18, 2003
Sold by
Martinez Jose M and Martinez Maria G
Bought by
Centeno Israel
Home Financials for this Owner
Home Financials are based on the most recent Mortgage that was taken out on this home.
Original Mortgage
$243,200
Interest Rate
6.3%
Mortgage Type
Purchase Money Mortgage
Create a Home Valuation Report for This Property
The Home Valuation Report is an in-depth analysis detailing your home's value as well as a comparison with similar homes in the area
Home Values in the Area
Average Home Value in this Area
Purchase History
| Date | Buyer | Sale Price | Title Company |
|---|---|---|---|
| Rojas Yolanda | -- | None Available | |
| Trejo John M | $255,000 | Fatcola | |
| Centeno Israel | $304,000 | Landsafe Title |
Source: Public Records
Mortgage History
| Date | Status | Borrower | Loan Amount |
|---|---|---|---|
| Open | Trejo John M | $250,381 | |
| Previous Owner | Centeno Israel | $243,200 | |
| Closed | Centeno Israel | $60,800 |
Source: Public Records
Tax History
| Year | Tax Paid | Tax Assessment Tax Assessment Total Assessment is a certain percentage of the fair market value that is determined by local assessors to be the total taxable value of land and additions on the property. | Land | Improvement |
|---|---|---|---|---|
| 2025 | $4,816 | $329,144 | $246,797 | $82,347 |
| 2024 | $4,816 | $322,691 | $241,958 | $80,733 |
| 2023 | $4,684 | $316,364 | $237,214 | $79,150 |
| 2022 | $4,475 | $310,162 | $232,563 | $77,599 |
| 2021 | $4,357 | $304,081 | $228,003 | $76,078 |
| 2019 | $4,325 | $295,064 | $221,242 | $73,822 |
| 2018 | $4,085 | $289,279 | $216,904 | $72,375 |
| 2016 | $3,686 | $278,047 | $208,482 | $69,565 |
| 2015 | $3,631 | $273,872 | $205,351 | $68,521 |
| 2014 | $3,586 | $268,508 | $201,329 | $67,179 |
Source: Public Records
Map
Nearby Homes
- 9515 Shade Ln
- 7686 Sunflower Dr
- 7679 Sunflower Dr
- 7705 Sage Dr
- 9273 Sierra Vista Cir
- 9522 Bascom St
- 8320 Orange Ave
- 8328 Buhman Ave
- 9734 Terradell St
- 9950 La Docena Ln
- 8551 Eglise Ave
- 8104 Arrington Ave
- 9602 Florpark St
- 7128 Farmland Ave
- 9213 Call St
- 8611 Eglise Ave
- 8414 Cravell Ave
- 9346 Canford St
- 7422 Bequette Ave
- 8905 Warvale St
- 9642 Planter St
- 9652 Planter St
- 9638 Planter St
- 9658 Planter St
- 9702 Planter St
- 9632 Planter St
- 9649 Planter St
- 9643 Planter St
- 9653 Planter St
- 9639 Planter St
- 9659 Planter St
- 9649 Myron St
- 9655 Myron St
- 9628 Planter St
- 9708 Planter St
- 9643 Myron St
- 9703 Myron St
- 9633 Planter St
- 9703 Planter St
- 9637 Myron St
Your Personal Tour Guide
Ask me questions while you tour the home.