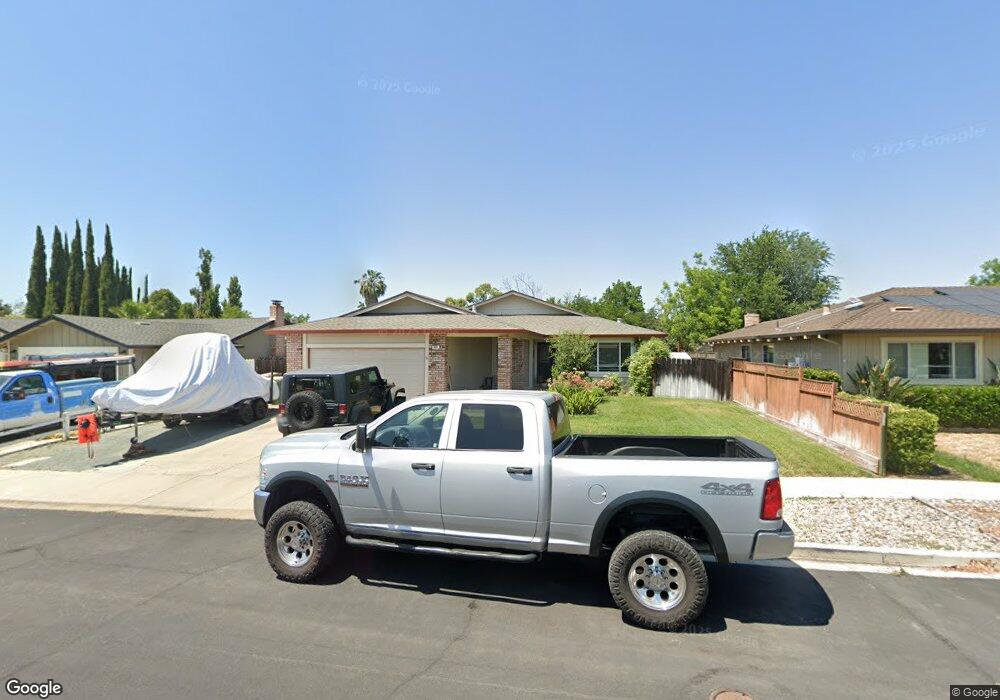
965 Oak St Brentwood, CA 94513
Estimated Value: $694,000 - $782,000
4
Beds
2
Baths
1,892
Sq Ft
$383/Sq Ft
Est. Value
About This Home
This home is located at 965 Oak St, Brentwood, CA 94513 and is currently estimated at $724,416, approximately $382 per square foot. 965 Oak St is a home located in Contra Costa County with nearby schools including Brentwood Elementary School, Edna Hill Middle School, and Liberty High School.
Ownership History
Date
Name
Owned For
Owner Type
Purchase Details
Closed on
May 16, 2002
Sold by
Engle Robert G
Bought by
Engle Robert G and Engle Shaney L
Current Estimated Value
Home Financials for this Owner
Home Financials are based on the most recent Mortgage that was taken out on this home.
Original Mortgage
$249,600
Outstanding Balance
$105,471
Interest Rate
6.94%
Mortgage Type
Purchase Money Mortgage
Estimated Equity
$618,945
Purchase Details
Closed on
May 25, 2001
Sold by
Engle Robert G and Engle Shaney L
Bought by
Engle Robert G
Home Financials for this Owner
Home Financials are based on the most recent Mortgage that was taken out on this home.
Original Mortgage
$173,500
Interest Rate
7.15%
Mortgage Type
Purchase Money Mortgage
Purchase Details
Closed on
Jul 10, 1998
Sold by
Cooksey Doff W and Cooksey Loretta R
Bought by
Engle Robert G and Engle Shaney L
Home Financials for this Owner
Home Financials are based on the most recent Mortgage that was taken out on this home.
Original Mortgage
$169,735
Interest Rate
7%
Mortgage Type
FHA
Create a Home Valuation Report for This Property
The Home Valuation Report is an in-depth analysis detailing your home's value as well as a comparison with similar homes in the area
Home Values in the Area
Average Home Value in this Area
Purchase History
| Date | Buyer | Sale Price | Title Company |
|---|---|---|---|
| Engle Robert G | -- | Chicago Title Co | |
| Engle Robert G | -- | First California Title Compa | |
| Engle Robert G | $173,500 | Old Republic Title Company |
Source: Public Records
Mortgage History
| Date | Status | Borrower | Loan Amount |
|---|---|---|---|
| Open | Engle Robert G | $249,600 | |
| Closed | Engle Robert G | $173,500 | |
| Closed | Engle Robert G | $169,735 | |
| Closed | Engle Robert G | $67,000 | |
| Closed | Engle Robert G | $20,000 |
Source: Public Records
Tax History Compared to Growth
Tax History
| Year | Tax Paid | Tax Assessment Tax Assessment Total Assessment is a certain percentage of the fair market value that is determined by local assessors to be the total taxable value of land and additions on the property. | Land | Improvement |
|---|---|---|---|---|
| 2025 | $3,941 | $342,389 | $62,695 | $279,694 |
| 2024 | $3,878 | $335,676 | $61,466 | $274,210 |
| 2023 | $3,878 | $329,095 | $60,261 | $268,834 |
| 2022 | $3,814 | $322,643 | $59,080 | $263,563 |
| 2021 | $3,714 | $316,318 | $57,922 | $258,396 |
| 2019 | $3,714 | $306,938 | $56,205 | $250,733 |
| 2018 | $3,514 | $300,920 | $55,103 | $245,817 |
| 2017 | $3,518 | $295,021 | $54,023 | $240,998 |
| 2016 | $3,393 | $289,237 | $52,964 | $236,273 |
| 2015 | $3,300 | $284,893 | $52,169 | $232,724 |
| 2014 | $3,288 | $279,314 | $51,148 | $228,166 |
Source: Public Records
Map
Nearby Homes
- 951 Dainty Ave
- 967 Dainty Ave
- 524 Bougainvilla Ct
- 730 Bramhall St
- 801 Villa Terrace
- 0 Road 3
- 875 Villa Terrace
- 0 Briones Valley Rd Unit 41100773
- 0 Briones Valley Rd Unit 41100771
- 800 Queen Palm Ln
- 855 Caribou Terrace
- 818 Queen Palm Ln
- 810 Coventry Cir
- 841 Fan Palm Ln
- 683 Avington Ct
- 738 Valley Green Dr
- 1011 Amanda Cir
- 927 Island Palm Way
- 235 Pecan Place
- 800 Minnesota Ave