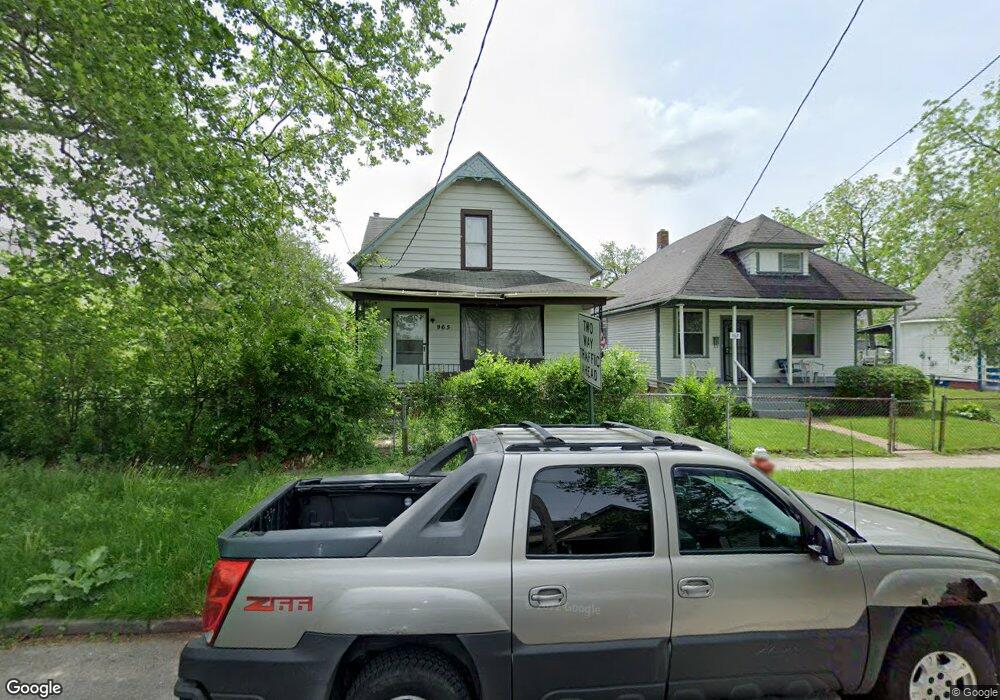
965 Post St Toledo, OH 43610
Downtown Toledo NeighborhoodEstimated Value: $45,560 - $83,000
3
Beds
1
Bath
1,122
Sq Ft
$58/Sq Ft
Est. Value
About This Home
This home is located at 965 Post St, Toledo, OH 43610 and is currently estimated at $64,640, approximately $57 per square foot. 965 Post St is a home located in Lucas County with nearby schools including Glenwood Elementary School, Jesup W. Scott High School, and Rosary Cathedral School.
Ownership History
Date
Name
Owned For
Owner Type
Purchase Details
Closed on
Aug 21, 2002
Sold by
Cimarron Mortgage Company and Dba The Mortgage Warehouse
Bought by
Williamson Carmen
Current Estimated Value
Purchase Details
Closed on
Dec 28, 2001
Sold by
Jennifer Gaston
Bought by
Cimarron Mtg Company and The Mtg Warehouse
Purchase Details
Closed on
Dec 14, 2000
Sold by
Louisville Title Agency For Nw Ohio Inc
Bought by
Patton Daniel F and Patton Jackie L
Purchase Details
Closed on
Aug 5, 1999
Sold by
Stevens Gioconda Elizabeth
Bought by
Gaston Jennifer
Home Financials for this Owner
Home Financials are based on the most recent Mortgage that was taken out on this home.
Original Mortgage
$36,000
Interest Rate
11.37%
Purchase Details
Closed on
Sep 27, 1996
Sold by
United Companies Lending
Bought by
Stevens Gioconda E
Purchase Details
Closed on
Mar 22, 1996
Sold by
Telb James A
Bought by
United Companies Lending Corp
Purchase Details
Closed on
Nov 8, 1990
Sold by
Snell Nathaniel P
Create a Home Valuation Report for This Property
The Home Valuation Report is an in-depth analysis detailing your home's value as well as a comparison with similar homes in the area
Home Values in the Area
Average Home Value in this Area
Purchase History
| Date | Buyer | Sale Price | Title Company |
|---|---|---|---|
| Williamson Carmen | $3,000 | Midland | |
| Cimarron Mtg Company | $14,000 | -- | |
| Patton Daniel F | $53,500 | Louisville Title Agency For | |
| Gaston Jennifer | $45,000 | -- | |
| Stevens Gioconda E | $2,000 | -- | |
| United Companies Lending Corp | $2,000 | -- | |
| -- | $4,800 | -- |
Source: Public Records
Mortgage History
| Date | Status | Borrower | Loan Amount |
|---|---|---|---|
| Previous Owner | Gaston Jennifer | $36,000 |
Source: Public Records
Tax History
| Year | Tax Paid | Tax Assessment Tax Assessment Total Assessment is a certain percentage of the fair market value that is determined by local assessors to be the total taxable value of land and additions on the property. | Land | Improvement |
|---|---|---|---|---|
| 2025 | $35,622 | $9,765 | $2,450 | $7,315 |
| 2024 | $31,698 | $9,765 | $2,450 | $7,315 |
| 2023 | $723 | $6,230 | $2,625 | $3,605 |
| 2022 | $959 | $6,230 | $2,625 | $3,605 |
| 2021 | $791 | $6,230 | $2,625 | $3,605 |
| 2020 | $815 | $5,355 | $2,240 | $3,115 |
| 2019 | $636 | $5,355 | $2,240 | $3,115 |
| 2018 | $669 | $5,355 | $2,240 | $3,115 |
| 2017 | $10,722 | $6,440 | $2,135 | $4,305 |
| 2016 | $8,834 | $18,400 | $6,100 | $12,300 |
| 2015 | $1,634 | $18,400 | $6,100 | $12,300 |
| 2014 | $625 | $6,450 | $2,140 | $4,310 |
| 2013 | $417 | $6,450 | $2,140 | $4,310 |
Source: Public Records
Map
Nearby Homes
- 2458 Lawton Ave
- 2534 Maplewood Ave
- 2740 Albion St
- 2368 Hollywood Ave
- 2410 Lawrence Ave
- 2841 N Detroit Ave
- 2360 Maplewood Ave
- 811 Collins St
- 2520 Robinwood Ave
- 2727 Robinwood Ave
- 2867 N Detroit Ave
- 2639 Scottwood Ave
- 2740 Robinwood Ave
- 1303 S Cove Blvd
- 1330 Palmetto Ave
- 1401 Palmetto Ave
- 2631 Parkwood Ave
- 2840 Scottwood Ave
- 2721 Parkwood Ave
- 511 W Delaware Ave
Your Personal Tour Guide
Ask me questions while you tour the home.