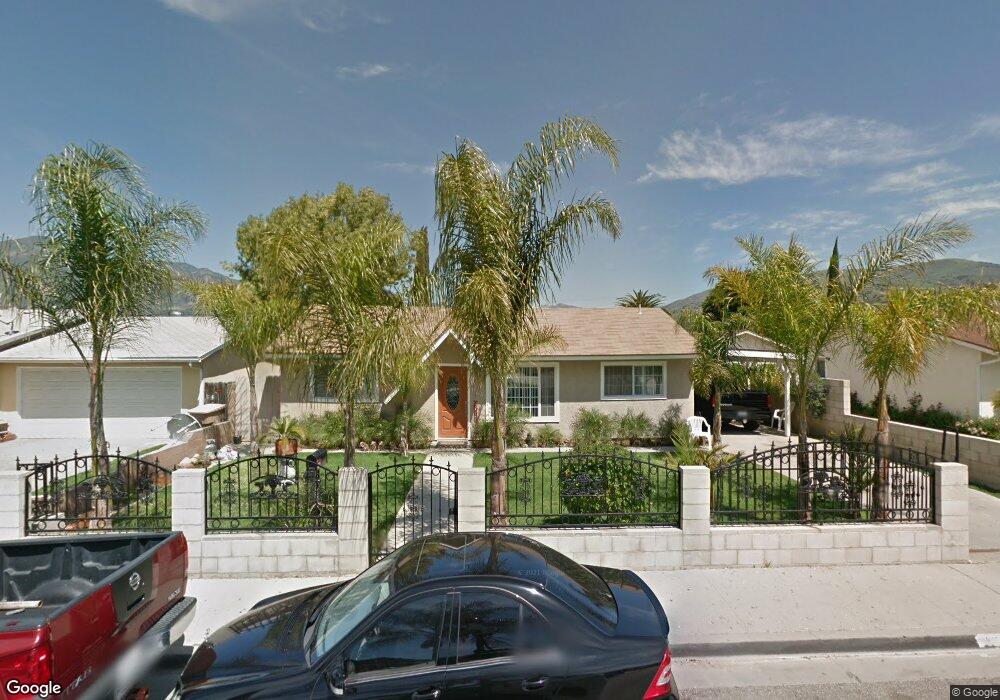
965 Wileman St Fillmore, CA 93015
Estimated Value: $559,000 - $644,000
3
Beds
2
Baths
1,120
Sq Ft
$537/Sq Ft
Est. Value
About This Home
This home is located at 965 Wileman St, Fillmore, CA 93015 and is currently estimated at $601,945, approximately $537 per square foot. 965 Wileman St is a home located in Ventura County with nearby schools including Fillmore Senior High.
Ownership History
Date
Name
Owned For
Owner Type
Purchase Details
Closed on
Jan 20, 2004
Sold by
Sandoval Jose R and Garcia Juan
Bought by
Sandoval Jose R and Sandoval Maria L
Current Estimated Value
Purchase Details
Closed on
Sep 23, 2002
Sold by
Sandoval Maribel
Bought by
Garcia Juan
Home Financials for this Owner
Home Financials are based on the most recent Mortgage that was taken out on this home.
Original Mortgage
$147,881
Outstanding Balance
$59,924
Interest Rate
5.83%
Mortgage Type
FHA
Estimated Equity
$542,021
Purchase Details
Closed on
Jun 8, 1999
Sold by
Gonzalo Ponce
Bought by
Sandoval Jose R and Garcia Juan
Home Financials for this Owner
Home Financials are based on the most recent Mortgage that was taken out on this home.
Original Mortgage
$149,003
Interest Rate
7.64%
Mortgage Type
FHA
Purchase Details
Closed on
Mar 3, 1995
Sold by
Ponce Gonzalo and Ponce Sylvia
Bought by
Ponce Gonzalo
Create a Home Valuation Report for This Property
The Home Valuation Report is an in-depth analysis detailing your home's value as well as a comparison with similar homes in the area
Home Values in the Area
Average Home Value in this Area
Purchase History
| Date | Buyer | Sale Price | Title Company |
|---|---|---|---|
| Sandoval Jose R | -- | -- | |
| Garcia Juan | -- | American Title Co | |
| Sandoval Jose R | $150,000 | Old Republic Title Company | |
| Ponce Gonzalo | -- | -- |
Source: Public Records
Mortgage History
| Date | Status | Borrower | Loan Amount |
|---|---|---|---|
| Open | Garcia Juan | $147,881 | |
| Previous Owner | Sandoval Jose R | $149,003 |
Source: Public Records
Tax History Compared to Growth
Tax History
| Year | Tax Paid | Tax Assessment Tax Assessment Total Assessment is a certain percentage of the fair market value that is determined by local assessors to be the total taxable value of land and additions on the property. | Land | Improvement |
|---|---|---|---|---|
| 2025 | $2,593 | $238,717 | $92,206 | $146,511 |
| 2024 | $2,593 | $234,037 | $90,398 | $143,639 |
| 2023 | $2,557 | $229,449 | $88,626 | $140,823 |
| 2022 | $2,363 | $224,950 | $86,888 | $138,062 |
| 2021 | $2,684 | $220,540 | $85,185 | $135,355 |
| 2020 | $2,489 | $218,280 | $84,312 | $133,968 |
| 2019 | $2,495 | $214,001 | $82,659 | $131,342 |
| 2018 | $2,444 | $209,806 | $81,039 | $128,767 |
| 2017 | $2,457 | $205,693 | $79,450 | $126,243 |
| 2016 | $2,275 | $201,661 | $77,893 | $123,768 |
| 2015 | $2,210 | $198,634 | $76,724 | $121,910 |
| 2014 | $2,208 | $194,745 | $75,222 | $119,523 |
Source: Public Records
Map
Nearby Homes
- 232 Village Square
- 300 C St
- 1050 King St
- 939 Meadowlark Dr
- 803 Sespe Ave
- 1032 Meadowlark Dr
- 1028 Meadowlark Dr
- 600 C St
- 1062 Meadowlark Dr
- 621 Lemon Way
- 863 Santa fe St
- 320 D St
- 62 Rio Grande St
- 245 D St
- 660 River St Unit D
- 241 Cottonwood Ln
- 569 Grapefruit Ln
- 595 Heritage Valley Pkwy
- 340 Central Ave
- 89 Willow St