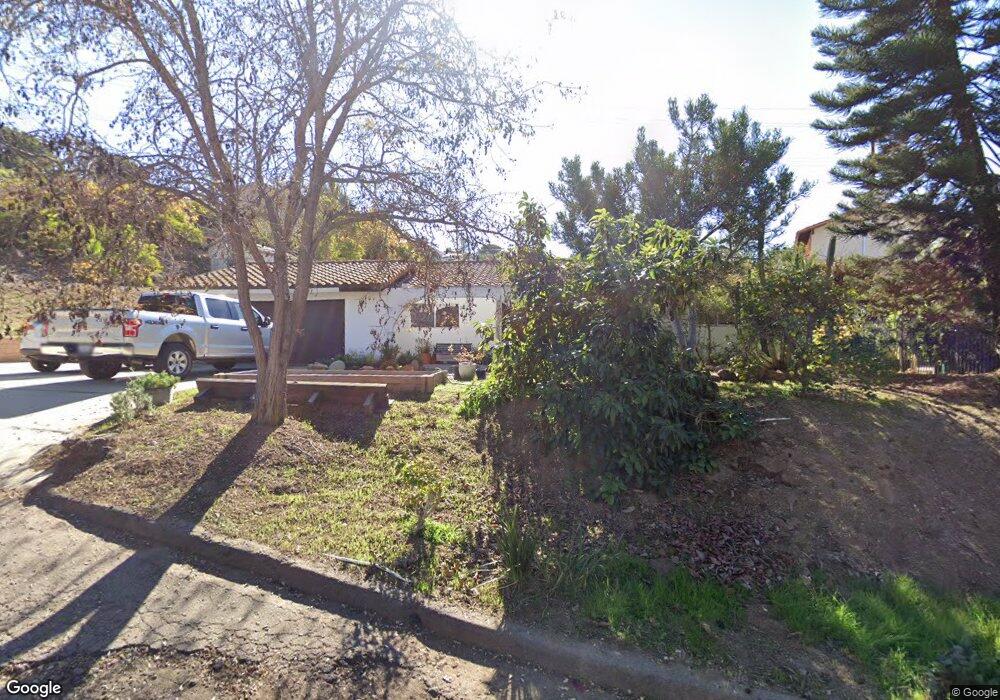
9657 Via Kenora Spring Valley, CA 91977
Estimated Value: $788,000 - $867,000
3
Beds
2
Baths
1,485
Sq Ft
$558/Sq Ft
Est. Value
About This Home
This home is located at 9657 Via Kenora, Spring Valley, CA 91977 and is currently estimated at $828,416, approximately $557 per square foot. 9657 Via Kenora is a home located in San Diego County with nearby schools including Spring Valley Middle School, Highlands Elementary School, and Monte Vista High School.
Ownership History
Date
Name
Owned For
Owner Type
Purchase Details
Closed on
Jul 22, 2016
Sold by
Walker Josefina
Bought by
Walker Stephen C
Current Estimated Value
Home Financials for this Owner
Home Financials are based on the most recent Mortgage that was taken out on this home.
Original Mortgage
$337,980
Outstanding Balance
$269,636
Interest Rate
3.56%
Mortgage Type
New Conventional
Estimated Equity
$558,780
Purchase Details
Closed on
Sep 18, 2015
Sold by
Walker Josefina
Bought by
Walker Stephen C
Home Financials for this Owner
Home Financials are based on the most recent Mortgage that was taken out on this home.
Original Mortgage
$338,760
Interest Rate
3.89%
Mortgage Type
New Conventional
Purchase Details
Closed on
Dec 22, 2008
Sold by
Walker Maricela
Bought by
Walker Stephen C
Purchase Details
Closed on
Dec 6, 2001
Sold by
Edison Maria G
Bought by
Walker Stephen C and Walker Maricela
Home Financials for this Owner
Home Financials are based on the most recent Mortgage that was taken out on this home.
Original Mortgage
$220,000
Interest Rate
6.57%
Purchase Details
Closed on
Nov 16, 1988
Create a Home Valuation Report for This Property
The Home Valuation Report is an in-depth analysis detailing your home's value as well as a comparison with similar homes in the area
Home Values in the Area
Average Home Value in this Area
Purchase History
| Date | Buyer | Sale Price | Title Company |
|---|---|---|---|
| Walker Stephen C | -- | First Amer Title Ins Agency | |
| Walker Stephen C | -- | First American Title Ofs | |
| Walker Stephen C | -- | None Available | |
| Walker Stephen C | $275,000 | United Title Company | |
| -- | $160,000 | -- |
Source: Public Records
Mortgage History
| Date | Status | Borrower | Loan Amount |
|---|---|---|---|
| Open | Walker Stephen C | $337,980 | |
| Closed | Walker Stephen C | $338,760 | |
| Previous Owner | Walker Stephen C | $220,000 |
Source: Public Records
Tax History
| Year | Tax Paid | Tax Assessment Tax Assessment Total Assessment is a certain percentage of the fair market value that is determined by local assessors to be the total taxable value of land and additions on the property. | Land | Improvement |
|---|---|---|---|---|
| 2025 | $5,236 | $406,230 | $137,834 | $268,396 |
| 2024 | $5,236 | $398,266 | $135,132 | $263,134 |
| 2023 | $5,071 | $390,458 | $132,483 | $257,975 |
| 2022 | $4,988 | $382,803 | $129,886 | $252,917 |
| 2021 | $4,938 | $375,298 | $127,340 | $247,958 |
| 2020 | $4,741 | $371,451 | $126,035 | $245,416 |
| 2019 | $4,670 | $364,168 | $123,564 | $240,604 |
| 2018 | $4,532 | $357,029 | $121,142 | $235,887 |
| 2017 | $4,428 | $350,029 | $118,767 | $231,262 |
| 2016 | $4,265 | $343,167 | $116,439 | $226,728 |
| 2015 | $4,230 | $338,013 | $114,690 | $223,323 |
| 2014 | $4,151 | $331,393 | $112,444 | $218,949 |
Source: Public Records
Map
Nearby Homes
- 3237 S Bonita St
- 3365 S Bonita St
- 3557 Kenora Dr Unit 22
- 9517 Bray Ave
- 3404 S Cordoba Ave
- 9860 Dale Ave Unit C12
- 9860 Dale Ave Unit B9
- 9860 Dale Ave Unit C3
- 9938 Buena Vista Dr Unit 3
- 3612 S Cordoba Ave Unit 14
- 9356 1 2 Lamar St
- 9869 Aldergrove Ln
- 9948 San Juan St Unit 4
- 0 Campo Rd Unit PTP2600859
- 3821-23 Rogers Ln
- 4001 N Bonita St
- 9881 Aldergrove Ln
- 10061 Canyonside Ct
- 9309 Hillside Dr
- 3404 Helix St
- 9641 Via Kenora
- 9645 Via Kenora
- 9665 Via Kenora
- 9642 Via Kenora
- 9669 Via Kenora
- 9639 Via Kenora
- 9640 Via Kenora
- 9671 Kenora Ln
- 9767 Kenora Woods Ln
- 9683 Via Kenora
- 9636 Via Kenora
- 9705 Kenora Ln
- 3372 Mandy Ln
- 9786 Kenora Woods Ln
- 9759 Kenora Woods Ln
- 9680 Via Kenora
- 9626 Via Kenora
- 9774 Kenora Woods Ln
- 9691 Via Kenora
- 3325 Mandy Ln
Your Personal Tour Guide
Ask me questions while you tour the home.