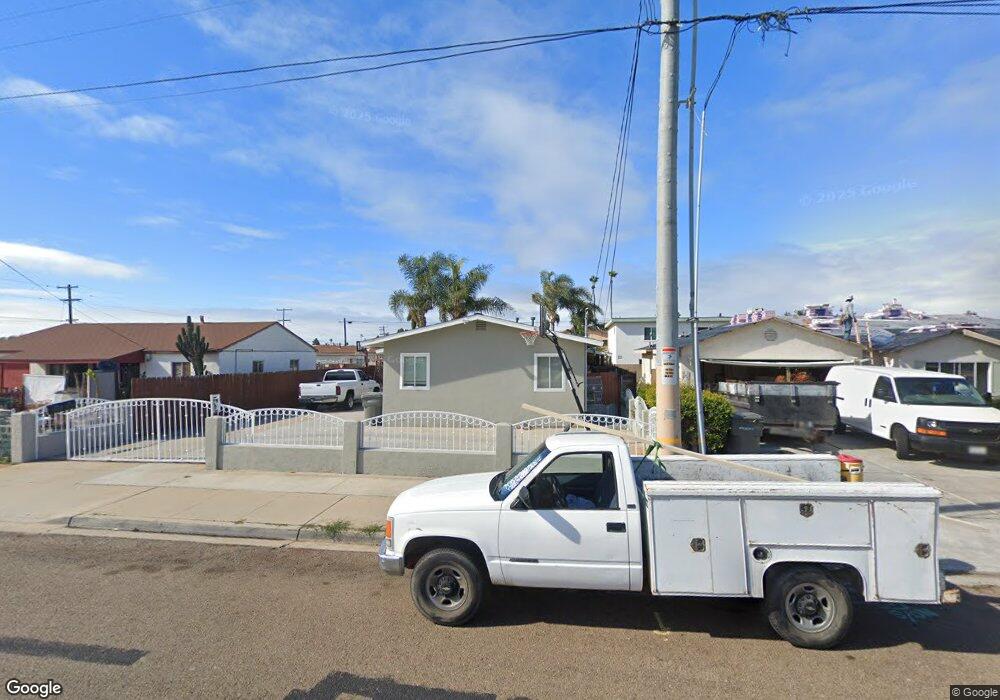
966 10th St Unit 68 Imperial Beach, CA 91932
Estimated Value: $988,413 - $1,123,000
4
Beds
2
Baths
748
Sq Ft
$1,380/Sq Ft
Est. Value
About This Home
This home is located at 966 10th St Unit 68, Imperial Beach, CA 91932 and is currently estimated at $1,032,103, approximately $1,379 per square foot. 966 10th St Unit 68 is a home located in San Diego County with nearby schools including Mar Vista Academy, Mar Vista Senior High School, and Imperial Beach Charter School.
Ownership History
Date
Name
Owned For
Owner Type
Purchase Details
Closed on
Mar 9, 2010
Sold by
The Bank Of New York Mellon
Bought by
Niebla Ruben
Current Estimated Value
Home Financials for this Owner
Home Financials are based on the most recent Mortgage that was taken out on this home.
Original Mortgage
$298,493
Interest Rate
5.5%
Mortgage Type
FHA
Purchase Details
Closed on
Jun 16, 2009
Sold by
Almaraz Gerardo and Almaraz Laura
Bought by
The Bank Of New York Mellon
Purchase Details
Closed on
Dec 27, 1999
Sold by
Mccall Living Trust A 06-26-90 and Mary E
Bought by
Almaraz Gerardo and Almaraz Laura
Home Financials for this Owner
Home Financials are based on the most recent Mortgage that was taken out on this home.
Original Mortgage
$143,840
Interest Rate
5.55%
Purchase Details
Closed on
Mar 31, 1997
Sold by
Mccall Living Trust 06-26-90 and Mary E
Bought by
Mccall Mary E
Create a Home Valuation Report for This Property
The Home Valuation Report is an in-depth analysis detailing your home's value as well as a comparison with similar homes in the area
Home Values in the Area
Average Home Value in this Area
Purchase History
| Date | Buyer | Sale Price | Title Company |
|---|---|---|---|
| Niebla Ruben | $304,000 | Landsafe Title | |
| Niebla Ruben | -- | Landsafe Title | |
| The Bank Of New York Mellon | $245,756 | Landsafe Title | |
| Almaraz Gerardo | $160,000 | Commonwealth Land Title Co | |
| Mccall Mary E | -- | -- |
Source: Public Records
Mortgage History
| Date | Status | Borrower | Loan Amount |
|---|---|---|---|
| Previous Owner | Niebla Ruben | $298,493 | |
| Previous Owner | Almaraz Gerardo | $143,840 |
Source: Public Records
Tax History Compared to Growth
Tax History
| Year | Tax Paid | Tax Assessment Tax Assessment Total Assessment is a certain percentage of the fair market value that is determined by local assessors to be the total taxable value of land and additions on the property. | Land | Improvement |
|---|---|---|---|---|
| 2025 | $6,565 | $470,481 | $228,410 | $242,071 |
| 2024 | $6,565 | $461,257 | $223,932 | $237,325 |
| 2023 | $6,714 | $452,214 | $219,542 | $232,672 |
| 2022 | $6,454 | $443,348 | $215,238 | $228,110 |
| 2021 | $6,511 | $434,656 | $211,018 | $223,638 |
| 2020 | $5,909 | $430,200 | $208,855 | $221,345 |
| 2019 | $5,484 | $401,765 | $204,760 | $197,005 |
| 2018 | $4,873 | $344,869 | $200,746 | $144,123 |
| 2017 | $140 | $338,108 | $196,810 | $141,298 |
| 2016 | $4,816 | $331,479 | $192,951 | $138,528 |
| 2015 | $4,744 | $326,501 | $190,053 | $136,448 |
| 2014 | $4,593 | $320,107 | $186,331 | $133,776 |
Source: Public Records
Map
Nearby Homes
- 966 10th St
- 976 10th St
- 960 10th St Unit 64
- 980 Elder Ave
- 948 10th St Unit 50
- 969 Emory St Unit 73
- 961 Emory St
- 977 Emory St
- 940 10th St Unit 42
- 953 Emory St
- 981 Elder Ave Unit 83
- 963 10th St Unit 65
- 951 Emory St Unit 2
- 949 Emory St
- 1007 10th St
- 1007 10th St Unit FL1-ID1035837P
- 975 10th St
- 936 10th St Unit 38
- 1004 10th St Unit 6
- 1020 10th St Unit 2