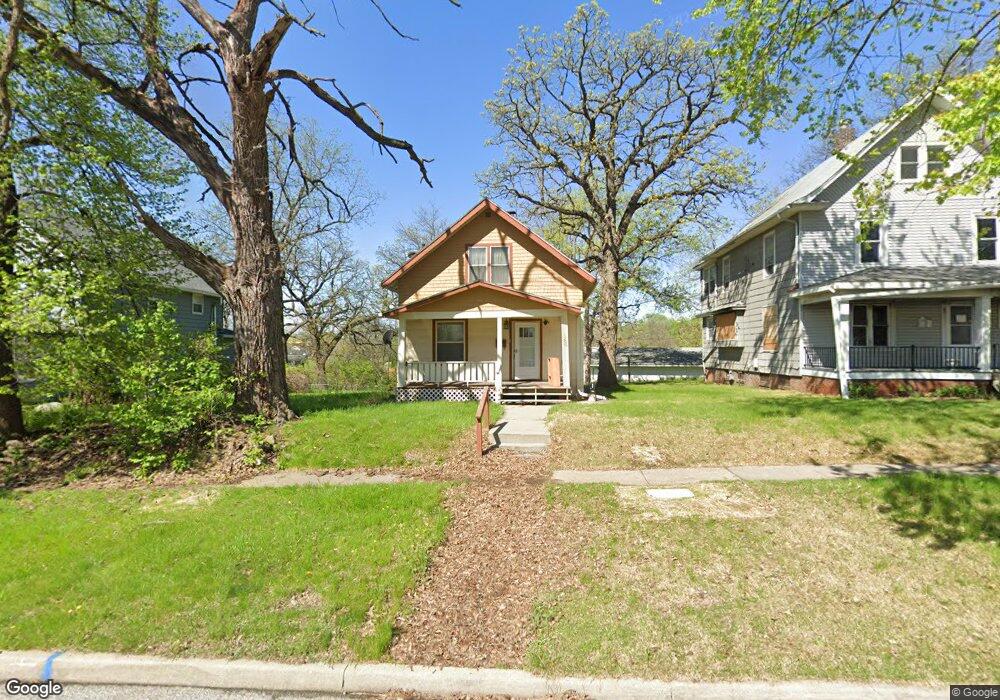
966 26th St Des Moines, IA 50312
Drake NeighborhoodEstimated Value: $124,000 - $147,774
2
Beds
2
Baths
955
Sq Ft
$138/Sq Ft
Est. Value
About This Home
This home is located at 966 26th St, Des Moines, IA 50312 and is currently estimated at $131,444, approximately $137 per square foot. 966 26th St is a home located in Polk County with nearby schools including Roosevelt High School.
Ownership History
Date
Name
Owned For
Owner Type
Purchase Details
Closed on
Feb 7, 2025
Sold by
Drj Investments Llc
Bought by
Cutler Construction Company and Capital Homes Ii Llc
Current Estimated Value
Home Financials for this Owner
Home Financials are based on the most recent Mortgage that was taken out on this home.
Original Mortgage
$122,590
Outstanding Balance
$121,776
Interest Rate
7.04%
Mortgage Type
New Conventional
Estimated Equity
$9,668
Purchase Details
Closed on
Nov 16, 2023
Sold by
Linda Glover Revocable Real Estate Trust
Bought by
Drj Investments Llc
Purchase Details
Closed on
Nov 21, 2019
Sold by
Glover Linda
Bought by
Linda Glover Revocable Real Estate Trust
Purchase Details
Closed on
Jan 15, 1999
Sold by
Gustafson Bradley D
Bought by
Glover Linda
Home Financials for this Owner
Home Financials are based on the most recent Mortgage that was taken out on this home.
Original Mortgage
$51,300
Interest Rate
6.38%
Create a Home Valuation Report for This Property
The Home Valuation Report is an in-depth analysis detailing your home's value as well as a comparison with similar homes in the area
Home Values in the Area
Average Home Value in this Area
Purchase History
| Date | Buyer | Sale Price | Title Company |
|---|---|---|---|
| Cutler Construction Company | $121,500 | None Listed On Document | |
| Drj Investments Llc | $80,000 | None Listed On Document | |
| Drj Investments Llc | $80,000 | None Listed On Document | |
| Linda Glover Revocable Real Estate Trust | -- | None Available | |
| Glover Linda | $56,500 | -- |
Source: Public Records
Mortgage History
| Date | Status | Borrower | Loan Amount |
|---|---|---|---|
| Open | Cutler Construction Company | $122,590 | |
| Previous Owner | Glover Linda | $51,300 |
Source: Public Records
Tax History Compared to Growth
Tax History
| Year | Tax Paid | Tax Assessment Tax Assessment Total Assessment is a certain percentage of the fair market value that is determined by local assessors to be the total taxable value of land and additions on the property. | Land | Improvement |
|---|---|---|---|---|
| 2025 | $1,726 | $98,000 | $15,200 | $82,800 |
| 2024 | $1,726 | $98,200 | $13,100 | $85,100 |
| 2023 | $1,598 | $98,200 | $13,100 | $85,100 |
| 2022 | $1,584 | $76,700 | $10,600 | $66,100 |
| 2021 | $1,474 | $76,700 | $10,600 | $66,100 |
| 2020 | $1,526 | $67,700 | $9,400 | $58,300 |
| 2019 | $1,526 | $67,700 | $9,400 | $58,300 |
| 2018 | $1,506 | $65,300 | $7,300 | $58,000 |
| 2017 | $1,382 | $65,300 | $7,300 | $58,000 |
| 2016 | $1,340 | $59,600 | $6,600 | $53,000 |
| 2015 | $1,340 | $59,600 | $6,600 | $53,000 |
| 2014 | $1,310 | $60,100 | $6,100 | $54,000 |
Source: Public Records
Map
Nearby Homes