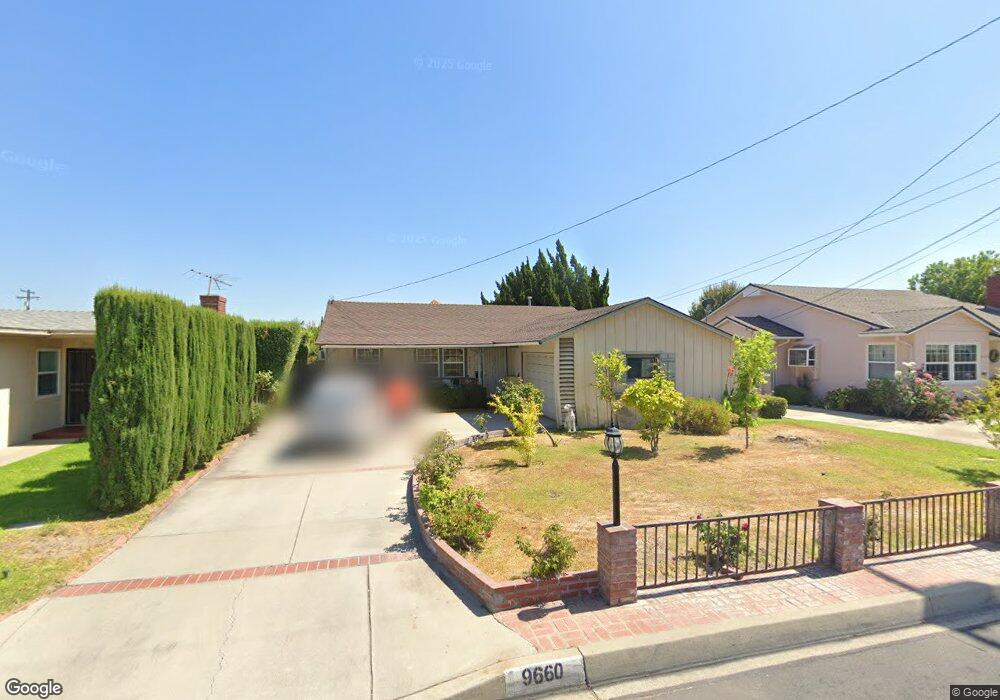
9660 Ardendale Ave Arcadia, CA 91007
Estimated Value: $1,085,177 - $1,188,000
3
Beds
2
Baths
1,136
Sq Ft
$1,006/Sq Ft
Est. Value
About This Home
This home is located at 9660 Ardendale Ave, Arcadia, CA 91007 and is currently estimated at $1,142,544, approximately $1,005 per square foot. 9660 Ardendale Ave is a home located in Los Angeles County with nearby schools including Longden Elementary School, Oak Avenue Intermediate School, and Temple City High School.
Ownership History
Date
Name
Owned For
Owner Type
Purchase Details
Closed on
Jan 6, 2015
Sold by
Huang Chih Chun
Bought by
Huang Chih Chun
Current Estimated Value
Purchase Details
Closed on
Dec 10, 2014
Sold by
Tan Angela Yahui
Bought by
Tan Dean
Purchase Details
Closed on
Aug 23, 2004
Sold by
Huang Chih Chun
Bought by
Huang Chih Chun
Purchase Details
Closed on
Jul 18, 1996
Sold by
Davis Royce E
Bought by
Huang Chih Chun
Home Financials for this Owner
Home Financials are based on the most recent Mortgage that was taken out on this home.
Original Mortgage
$131,625
Interest Rate
3.95%
Purchase Details
Closed on
Jun 24, 1996
Sold by
Tan Ping Shih
Bought by
Huang Chih Chun
Home Financials for this Owner
Home Financials are based on the most recent Mortgage that was taken out on this home.
Original Mortgage
$131,625
Interest Rate
3.95%
Create a Home Valuation Report for This Property
The Home Valuation Report is an in-depth analysis detailing your home's value as well as a comparison with similar homes in the area
Home Values in the Area
Average Home Value in this Area
Purchase History
| Date | Buyer | Sale Price | Title Company |
|---|---|---|---|
| Huang Chih Chun | -- | None Available | |
| Tan Dean | -- | Accommodation | |
| Huang Chih Chun | -- | -- | |
| Huang Chih Chun | $202,500 | Stewart Title | |
| Huang Chih Chun | -- | Stewart Title |
Source: Public Records
Mortgage History
| Date | Status | Borrower | Loan Amount |
|---|---|---|---|
| Previous Owner | Huang Chih Chun | $131,625 |
Source: Public Records
Tax History
| Year | Tax Paid | Tax Assessment Tax Assessment Total Assessment is a certain percentage of the fair market value that is determined by local assessors to be the total taxable value of land and additions on the property. | Land | Improvement |
|---|---|---|---|---|
| 2025 | $4,433 | $353,611 | $188,101 | $165,510 |
| 2024 | $4,433 | $346,678 | $184,413 | $162,265 |
| 2023 | $4,333 | $339,882 | $180,798 | $159,084 |
| 2022 | $4,068 | $333,218 | $177,253 | $155,965 |
| 2021 | $4,130 | $326,685 | $173,778 | $152,907 |
| 2020 | $4,074 | $323,337 | $171,997 | $151,340 |
| 2019 | $3,986 | $316,998 | $168,625 | $148,373 |
| 2018 | $3,829 | $310,783 | $165,319 | $145,464 |
| 2016 | $3,664 | $298,716 | $158,900 | $139,816 |
| 2015 | $3,601 | $294,230 | $156,514 | $137,716 |
| 2014 | $3,553 | $288,468 | $153,449 | $135,019 |
Source: Public Records
Map
Nearby Homes
- 1231 S Golden West Ave Unit 3
- 1222 Temple City Blvd
- 1228 Temple City Blvd
- 1211 S Golden West Ave Unit C
- 905 W Duarte Rd Unit A
- 1006 Arcadia Ave Unit D
- 1027 Arcadia Ave Unit C
- 1088 Sunset Blvd Unit A
- 1140 Arcadia Ave
- 6771 Oak Ave
- 9163 Duarte Rd
- 946 Fairview Ave Unit 8
- 1522 S Baldwin Ave Unit 15
- 914 Fairview Ave Unit 13
- 905 Sunset Blvd Unit A
- 1126 Fairview Ave Unit 210
- 1126 Fairview Ave Unit 106
- 662 W Norman Ave
- 9144 E Fairview Ave
- 1150 Okoboji Dr
- 9702 Ardendale Ave
- 9656 Ardendale Ave
- 9652 Ardendale Ave
- 9708 Ardendale Ave
- 9659 E Camino Real Ave
- 9703 E Camino Real Ave
- 9646 Ardendale Ave
- 9653 E Camino Real Ave
- 9712 Ardendale Ave
- 9665 Ardendale Ave
- 9659 Ardendale Ave
- 9705 Ardendale Ave
- 9709 E Camino Real Ave
- 9711 Ardendale Ave
- 9647 E Camino Real Ave
- 9718 Ardendale Ave
- 9649 Ardendale Ave
- 9642 Ardendale Ave
- 9711 E Camino Real Ave
- 9715 Ardendale Ave
Your Personal Tour Guide
Ask me questions while you tour the home.