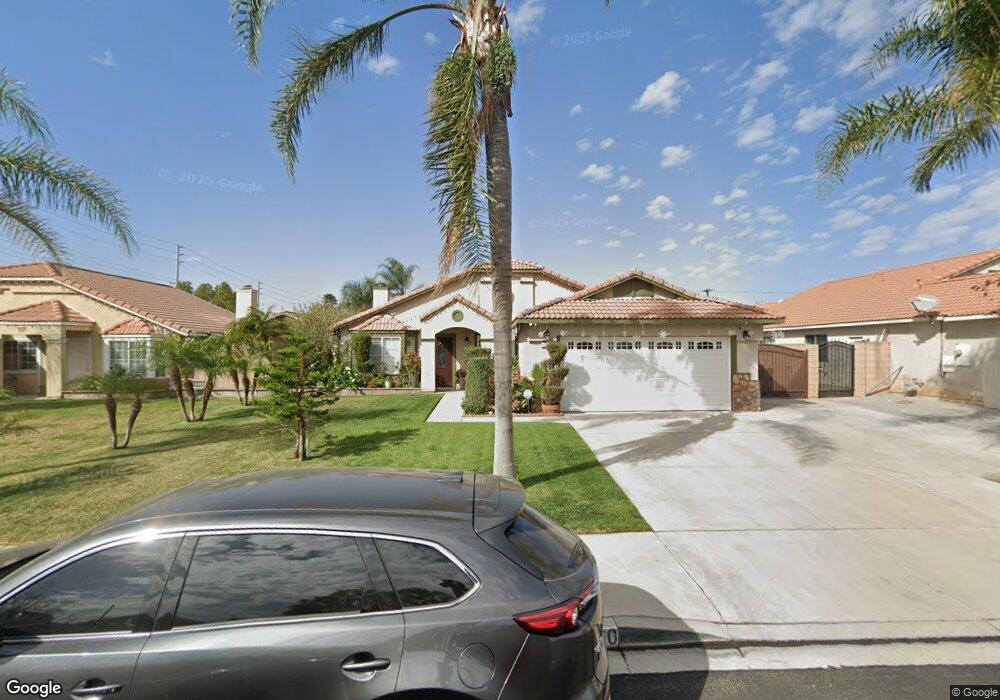
9660 Fremontia Ave Fontana, CA 92335
Estimated Value: $582,000 - $644,000
4
Beds
2
Baths
1,564
Sq Ft
$386/Sq Ft
Est. Value
About This Home
This home is located at 9660 Fremontia Ave, Fontana, CA 92335 and is currently estimated at $603,228, approximately $385 per square foot. 9660 Fremontia Ave is a home located in San Bernardino County with nearby schools including West Randall Elementary School, Sequoia Middle School, and Fontana High School.
Ownership History
Date
Name
Owned For
Owner Type
Purchase Details
Closed on
Apr 5, 2022
Sold by
Francisco Avitia
Bought by
Avitia Maria
Current Estimated Value
Purchase Details
Closed on
May 11, 2005
Sold by
Avitia Francisco
Bought by
Avitia Francisco and Avitia Maria
Home Financials for this Owner
Home Financials are based on the most recent Mortgage that was taken out on this home.
Original Mortgage
$134,000
Interest Rate
5.87%
Mortgage Type
New Conventional
Purchase Details
Closed on
Aug 28, 1997
Sold by
Rivera Noe Vega
Bought by
Avitia Francisco
Purchase Details
Closed on
Mar 17, 1997
Sold by
G M Lavitt Inc
Bought by
Rivera Noe Vega
Home Financials for this Owner
Home Financials are based on the most recent Mortgage that was taken out on this home.
Original Mortgage
$136,000
Interest Rate
7.74%
Mortgage Type
FHA
Create a Home Valuation Report for This Property
The Home Valuation Report is an in-depth analysis detailing your home's value as well as a comparison with similar homes in the area
Home Values in the Area
Average Home Value in this Area
Purchase History
| Date | Buyer | Sale Price | Title Company |
|---|---|---|---|
| Avitia Maria | -- | Wfg National Title | |
| Avitia Francisco | -- | Advantage Title Company | |
| Avitia Francisco | -- | -- | |
| Rivera Noe Vega | $138,000 | Orange Coast Title |
Source: Public Records
Mortgage History
| Date | Status | Borrower | Loan Amount |
|---|---|---|---|
| Previous Owner | Avitia Francisco | $134,000 | |
| Previous Owner | Rivera Noe Vega | $136,000 |
Source: Public Records
Tax History Compared to Growth
Tax History
| Year | Tax Paid | Tax Assessment Tax Assessment Total Assessment is a certain percentage of the fair market value that is determined by local assessors to be the total taxable value of land and additions on the property. | Land | Improvement |
|---|---|---|---|---|
| 2025 | $2,345 | $224,760 | $40,718 | $184,042 |
| 2024 | $2,345 | $220,353 | $39,920 | $180,433 |
| 2023 | $2,565 | $216,032 | $39,137 | $176,895 |
| 2022 | $2,275 | $211,796 | $38,370 | $173,426 |
| 2021 | $2,506 | $207,643 | $37,618 | $170,025 |
| 2020 | $2,380 | $205,514 | $37,232 | $168,282 |
| 2019 | $2,333 | $201,484 | $36,502 | $164,982 |
| 2018 | $2,207 | $197,533 | $35,786 | $161,747 |
| 2017 | $2,194 | $193,659 | $35,084 | $158,575 |
| 2016 | $2,158 | $189,862 | $34,396 | $155,466 |
| 2015 | $2,130 | $187,010 | $33,879 | $153,131 |
| 2014 | $2,127 | $183,346 | $33,215 | $150,131 |
Source: Public Records
Map
Nearby Homes
- 15162 Cambria St
- 9756 Elm Ave
- 9828 Carob Ave
- 9310 Carob St
- 15141 Randall Ave
- 9408 Poplar Ave
- 9963 Eugenia Ave
- 15413 Pine Ave
- 9153 Beech Ave
- 15317 Athol St
- 9833 Niagara Ave
- 15937 Manzanita Dr
- 15082 Valley Blvd
- 15867 Randall Ave
- 9059 Beech Ave
- 9226 Cattail Ln
- 14989 Hibiscus Ave
- 15994 Sequoia Ave
- 15278 Boyle Ave
- 14582 El Molino St
- 9670 Fremontia Ave
- 9650 Fremontia Ave
- 9665 Beech Ave
- 9675 Beech Ave
- 9655 Beech Ave
- 9640 Fremontia Ave
- 9680 Fremontia Ave
- 9661 Fremontia Ave
- 9671 Fremontia Ave
- 9645 Beech Ave
- 9685 Beech Ave
- 9651 Fremontia Ave
- 9630 Fremontia Ave
- 9681 Fremontia Ave
- 9641 Fremontia Ave
- 9635 Beech Ave
- 9631 Fremontia Ave
- 9620 Fremontia Ave
- 9625 Beech Ave
- 15355 Cambria St