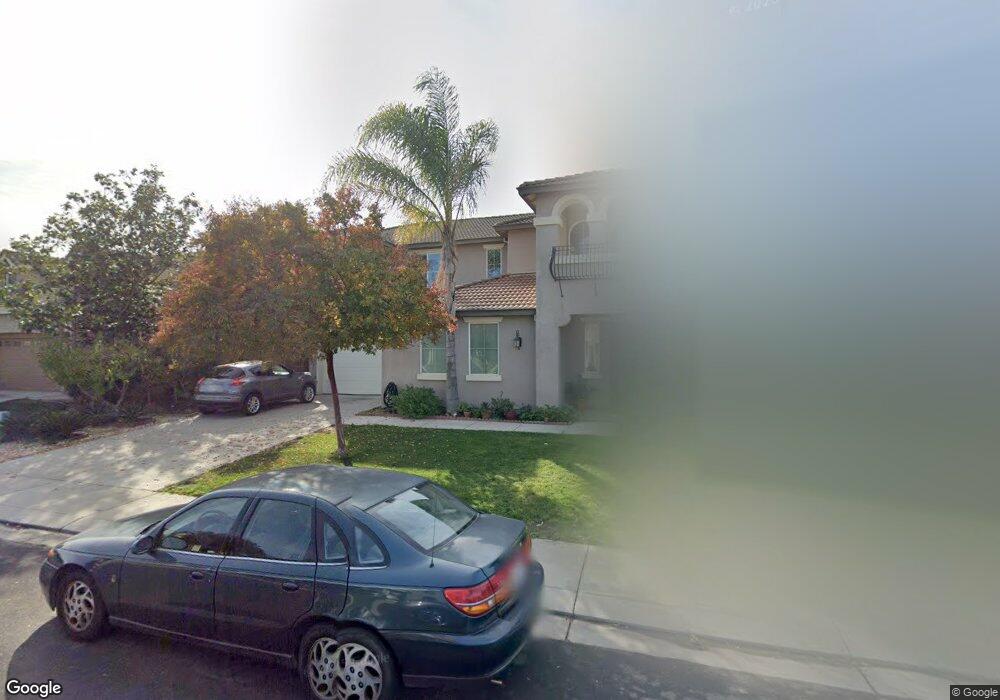
967 Alfonso Ln Manteca, CA 95336
Estimated Value: $609,000 - $699,000
About This Home
This home is located at 967 Alfonso Ln, Manteca, CA 95336 and is currently estimated at $659,185, approximately $249 per square foot. 967 Alfonso Ln is a home located in San Joaquin County with nearby schools including Joshua Cowell Elementary School, Manteca High School, and St. Anthony's Catholic School.
Ownership History
We collect this data history from publicly available records. To have your information removed, we recommend requesting removal directly through your county’s website.
Purchase Details
Home Financials for this Owner
Home Financials are based on the most recent Mortgage that was taken out on this home.Purchase Details
Purchase Details
Home Financials for this Owner
Home Financials are based on the most recent Mortgage that was taken out on this home.Purchase History
We collect this data history from publicly available records. To have your information removed, we recommend requesting removal directly through your county’s website.
| Date | Buyer | Sale Price | Title Company |
|---|---|---|---|
| $250,000 | Ticor Title Redlands | ||
| $198,489 | Accommodation | ||
| $464,000 | Chicago Title Co |
Mortgage History
We collect this data history from publicly available records. To have your information removed, we recommend requesting removal directly through your county’s website.
| Date | Status | Borrower | Loan Amount |
|---|---|---|---|
| Open | $245,471 | ||
| Previous Owner | $370,850 |
Tax History
We collect this data history from publicly available records. To have your information removed, we recommend requesting removal directly through your county’s website.
| Year | Tax Paid | Tax Assessment Tax Assessment Total Assessment is a certain percentage of the fair market value that is determined by local assessors to be the total taxable value of land and additions on the property. | Land | Improvement |
|---|---|---|---|---|
| 2025 | $5,260 | $322,687 | $80,025 | $242,662 |
| 2024 | $5,160 | $316,360 | $78,456 | $237,904 |
| 2023 | $5,117 | $310,158 | $76,918 | $233,240 |
| 2022 | $5,065 | $304,077 | $75,410 | $228,667 |
| 2021 | $5,006 | $298,116 | $73,932 | $224,184 |
| 2020 | $4,852 | $295,060 | $73,174 | $221,886 |
| 2019 | $4,789 | $289,276 | $71,740 | $217,536 |
| 2018 | $4,707 | $283,605 | $70,334 | $213,271 |
| 2017 | $4,611 | $278,045 | $68,955 | $209,090 |
| 2016 | $4,567 | $272,595 | $67,604 | $204,991 |
| 2014 | $4,244 | $263,245 | $65,285 | $197,960 |
Map
- 1152 Laureto St
- 1254 Parkcrest Cir
- 1283 Marceline Dr
- 1276 Parkcrest Cir
- 1306 Parkcrest Cir
- 953 Souza Blvd
- 1288 Parkcrest Cir
- 782 Shadowbrook Ln
- 1454 Trellis St
- 1322 Marceline Dr
- 1368 Crescent Ave
- 1042 Briar Ct
- 1371 Crescent Ave
- 1049 Briar Ct
- 1113 Sutter St
- 854 Conrad St
- 1275 Armstrong Dr
- 927 Conrad St
- 889 Conrad St
- 619 Heathridge St
Ask me questions while you tour the home.