
Seller's Agent in 2025
Juliet Wenzler
eXp Realty
(937) 823-9310
7 in this area
57 Total Sales
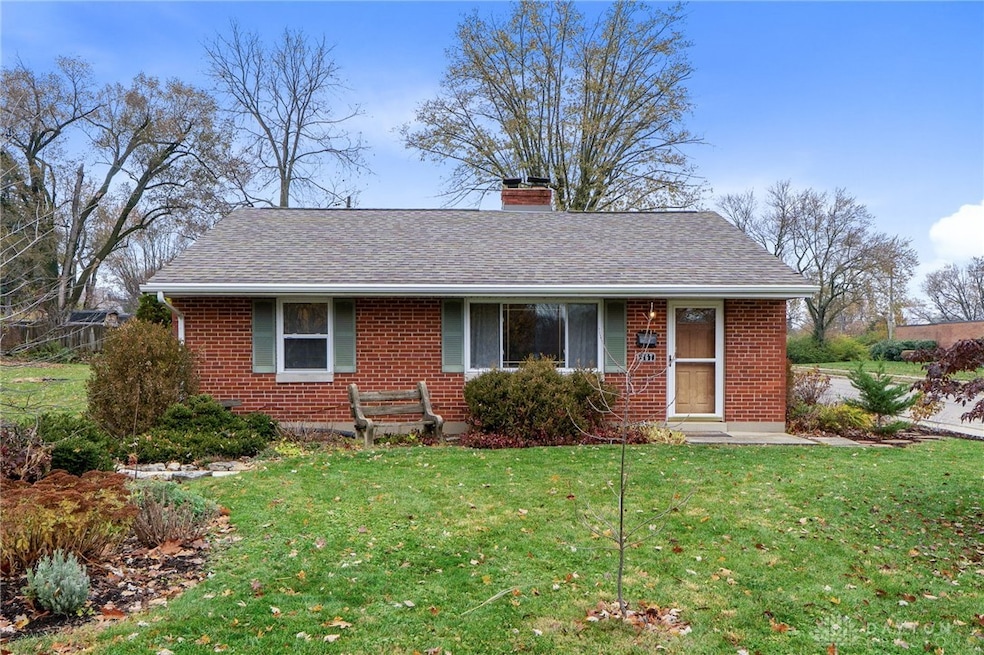
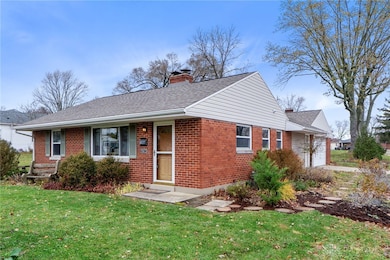
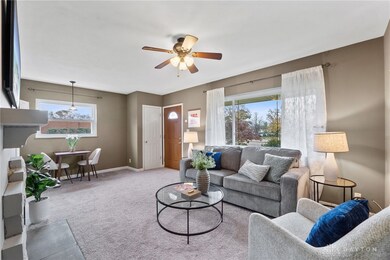
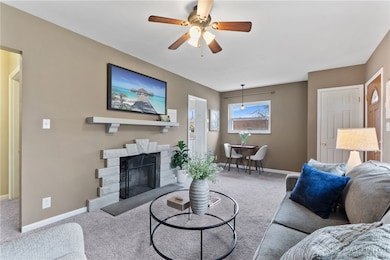
WOW! Charm awaits in this darling, extremely well cared for, brick ranch in a killer location in Kettering, Ohio. If easy, comfortable living is what you desire, you have found it in this updated 2 bedroom, 1 bathroom home, with attached, oversized, 2 car garage!
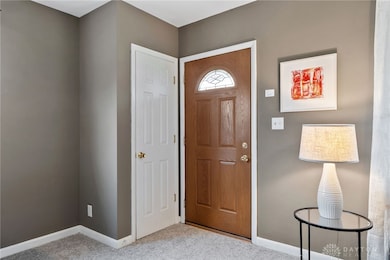
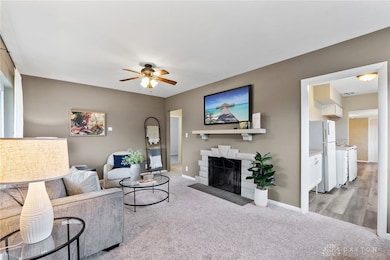
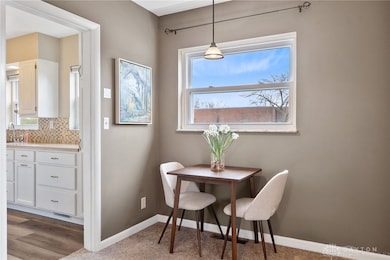
Sip your morning coffee in the cozy family room or out on your very private patio. This home offers a little oasis in the middle of Kettering! You will be inspired come Spring when all of the beautiful plants and flowers start to bloom! Updates to put your mind at ease: Roof 2017, New Siding 2018, Gas Water Heater 2018, Kitchen countertop, backsplash and the addition of cabinetry 2020, Washer & Dryer 2022, Kitchen & Family Room flooring 2024 and Brand new carpet througout 2025. Schedule your showing today, you will feel right at some as soon as you walk through the door!
Last Agent to Sell the Property
eXp Realty Brokerage Phone: (866) 212-4991 License #2018000582 Listed on: 11/20/2025
| Date | Type | Sale Price | Title Company |
|---|---|---|---|
| Warranty Deed | $84,900 | Attorney | |
| Limited Warranty Deed | -- | None Available | |
| Sheriffs Deed | $52,000 | None Available | |
| Certificate Of Transfer | -- | -- | |
| Certificate Of Transfer | -- | -- | |
| Certificate Of Transfer | -- | -- |
| Date | Status | Loan Amount | Loan Type |
|---|---|---|---|
| Open | $67,920 | Purchase Money Mortgage |
| Date | Event | Price | List to Sale | Price per Sq Ft |
|---|---|---|---|---|
| 12/19/2025 12/19/25 | Sold | $188,000 | +2.8% | $176 / Sq Ft |
| 11/20/2025 11/20/25 | For Sale | $182,900 | -- | $171 / Sq Ft |
| Year | Tax Paid | Tax Assessment Tax Assessment Total Assessment is a certain percentage of the fair market value that is determined by local assessors to be the total taxable value of land and additions on the property. | Land | Improvement |
|---|---|---|---|---|
| 2025 | $3,304 | $46,760 | $11,780 | $34,980 |
| 2024 | $3,219 | $46,760 | $11,780 | $34,980 |
| 2023 | $3,219 | $46,760 | $11,780 | $34,980 |
| 2022 | $3,091 | $35,170 | $8,860 | $26,310 |
| 2021 | $2,884 | $35,170 | $8,860 | $26,310 |
| 2020 | $2,893 | $35,170 | $8,860 | $26,310 |
| 2019 | $2,642 | $28,040 | $8,040 | $20,000 |
| 2018 | $2,654 | $28,040 | $8,040 | $20,000 |
| 2017 | $2,471 | $28,040 | $8,040 | $20,000 |
| 2016 | $2,572 | $27,610 | $8,040 | $19,570 |
| 2015 | $2,472 | $27,610 | $8,040 | $19,570 |
| 2014 | $2,472 | $27,610 | $8,040 | $19,570 |
| 2012 | -- | $28,120 | $8,030 | $20,090 |
Seller's Agent in 2025
Juliet Wenzler
eXp Realty
(937) 823-9310
7 in this area
57 Total Sales
Buyer's Agent in 2025
Tanza Everding
Howard Hanna Real Estate Serv
(937) 902-7778
2 in this area
84 Total Sales
Source: Dayton REALTORS®
MLS Number: 948163
APN: N64-00808-0053
Disclaimer: Certain information contained herein is derived from information provided by parties other than Homes.com. All information provided is deemed reliable, but is not guaranteed to be accurate and should be independently verified.
![]() The information is being provided by Dayton Area Board of Realtors MLS. Information deemed reliable but not guaranteed. Information is provided for the consumer's personal, non-commercial use, and may not be used for any purpose other than the identification of potential properties for purchase. Copyright 2026 Dayton Area Board of Realtors MLS. All Rights Reserved.
The information is being provided by Dayton Area Board of Realtors MLS. Information deemed reliable but not guaranteed. Information is provided for the consumer's personal, non-commercial use, and may not be used for any purpose other than the identification of potential properties for purchase. Copyright 2026 Dayton Area Board of Realtors MLS. All Rights Reserved.
Ask me questions while you tour the home.