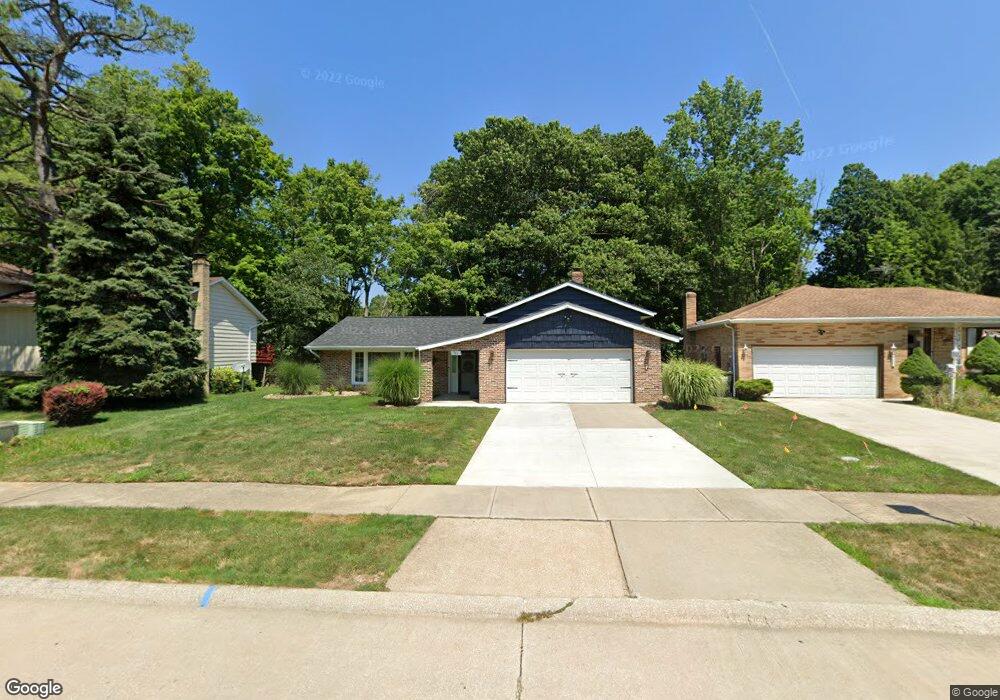
967 Carlone Place Cleveland, OH 44121
Estimated Value: $282,507 - $298,000
3
Beds
3
Baths
2,188
Sq Ft
$134/Sq Ft
Est. Value
About This Home
This home is located at 967 Carlone Place, Cleveland, OH 44121 and is currently estimated at $292,127, approximately $133 per square foot. 967 Carlone Place is a home located in Cuyahoga County with nearby schools including Adrian Elementary School, Greenview Upper Elementary School, and Memorial Junior High School.
Ownership History
Date
Name
Owned For
Owner Type
Purchase Details
Closed on
Apr 21, 2016
Sold by
Mae Top Holdings Ltd
Bought by
Henderson Michael T and Campbell Henderson Quinise N
Current Estimated Value
Home Financials for this Owner
Home Financials are based on the most recent Mortgage that was taken out on this home.
Original Mortgage
$131,079
Outstanding Balance
$104,779
Interest Rate
3.87%
Mortgage Type
FHA
Estimated Equity
$187,348
Purchase Details
Closed on
Jun 4, 2013
Sold by
Schneider Leo and Aveni Anthony J
Bought by
Mae Top Holdings Ltd
Purchase Details
Closed on
Oct 4, 1995
Sold by
Abbey Virginia L
Bought by
Ruth Vermillion/Krup Trust
Purchase Details
Closed on
Feb 23, 1984
Sold by
Abbey Harold K and Abbey Virginia L
Bought by
Abbey Harold K
Purchase Details
Closed on
Jan 1, 1975
Bought by
Abbey Harold K and Abbey Virginia L
Create a Home Valuation Report for This Property
The Home Valuation Report is an in-depth analysis detailing your home's value as well as a comparison with similar homes in the area
Home Values in the Area
Average Home Value in this Area
Purchase History
| Date | Buyer | Sale Price | Title Company |
|---|---|---|---|
| Henderson Michael T | $133,500 | Attorney | |
| Mae Top Holdings Ltd | $45,900 | Newman Title | |
| Ruth Vermillion/Krup Trust | $125,000 | -- | |
| Abbey Harold K | -- | -- | |
| Abbey Harold K | -- | -- |
Source: Public Records
Mortgage History
| Date | Status | Borrower | Loan Amount |
|---|---|---|---|
| Open | Henderson Michael T | $131,079 |
Source: Public Records
Tax History Compared to Growth
Tax History
| Year | Tax Paid | Tax Assessment Tax Assessment Total Assessment is a certain percentage of the fair market value that is determined by local assessors to be the total taxable value of land and additions on the property. | Land | Improvement |
|---|---|---|---|---|
| 2024 | $5,988 | $79,100 | $16,450 | $62,650 |
| 2023 | $5,555 | $59,050 | $13,440 | $45,610 |
| 2022 | $5,525 | $59,045 | $13,440 | $45,605 |
| 2021 | $5,481 | $59,050 | $13,440 | $45,610 |
| 2020 | $5,412 | $50,890 | $11,590 | $39,310 |
| 2019 | $4,936 | $145,400 | $33,100 | $112,300 |
| 2018 | $4,896 | $50,890 | $11,590 | $39,310 |
| 2017 | $5,033 | $47,920 | $9,730 | $38,190 |
| 2016 | $5,001 | $47,920 | $9,730 | $38,190 |
| 2015 | $4,880 | $47,920 | $9,730 | $38,190 |
| 2014 | $4,848 | $47,920 | $9,730 | $38,190 |
Source: Public Records
Map
Nearby Homes
- 4532 Anderson Rd
- 4561 Wilburn Dr
- 4591 Wilburn Dr
- 868 Haywood Dr
- 4742 Anderson Rd
- 4616 Mcfarland Rd
- 4769 Edenwood Rd
- 4514 E Berwald Rd
- 4643 Monticello Blvd
- 4781 Dorshwood Rd
- 981 Hanley Rd
- 4669 Liberty Rd
- 963 Chelston Rd
- 4765 Monticello Blvd
- 4406 Elmwood Rd
- 4650 Liberty Rd
- 4860 Anderson Rd
- 4493 Telhurst Rd
- 4289 Swaffield Dr
- 4258 Bluestone Rd
- 971 Carlone Place
- 963 Carlone Place
- 975 Carlone Place
- 4564 Anderson Rd
- 4550 Anderson Rd
- 4572 Anderson Rd
- 4540 Anderson Rd
- 979 Carlone Place
- 4584 Anderson Rd
- 964 Carlone Place
- 4536 Anderson Rd
- 983 Carlone Place
- 972 Carlone Place
- 976 Carlone Place
- 4588 Anderson Rd
- 4588 Anderson Rd
- 987 Carlone Place
- 4573 Anderson Rd
- 991 Carlone Place
- 988 Carlone Place