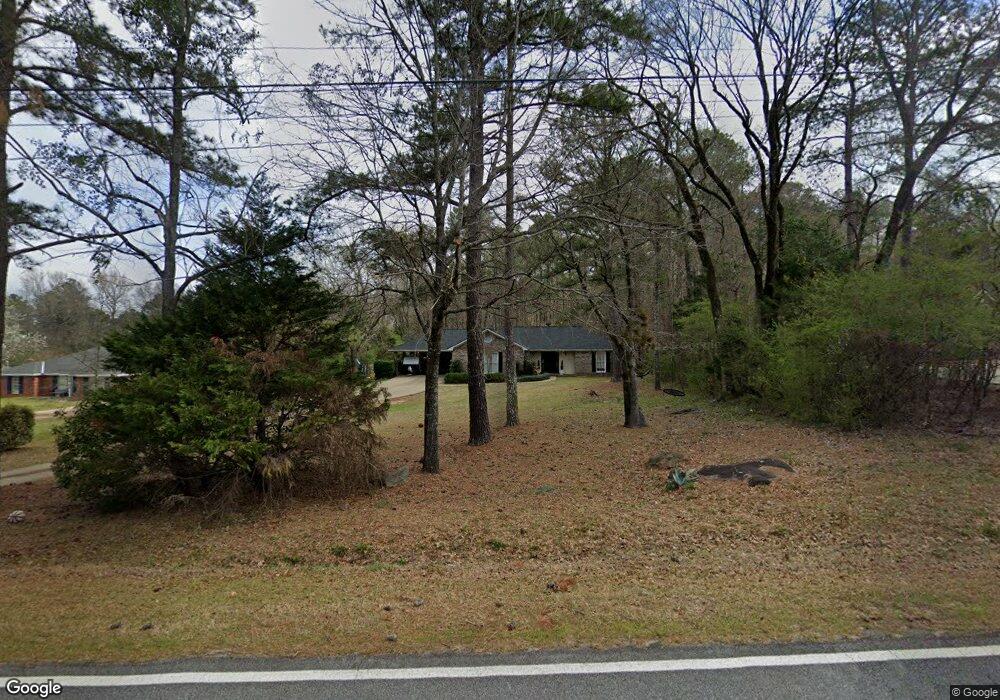
967 E Bonacre Rd Cataula, GA 31804
Estimated Value: $253,000 - $279,000
3
Beds
2
Baths
1,666
Sq Ft
$159/Sq Ft
Est. Value
About This Home
This home is located at 967 E Bonacre Rd, Cataula, GA 31804 and is currently estimated at $264,489, approximately $158 per square foot. 967 E Bonacre Rd is a home located in Harris County with nearby schools including Mulberry Creek Elementary School, Cogburn Woods Elementary School, and Harris County Carver Middle School.
Ownership History
Date
Name
Owned For
Owner Type
Purchase Details
Closed on
Feb 24, 2016
Sold by
Capistrano Investments Llc
Bought by
Christmas Kyle J
Current Estimated Value
Home Financials for this Owner
Home Financials are based on the most recent Mortgage that was taken out on this home.
Original Mortgage
$142,373
Outstanding Balance
$113,505
Interest Rate
3.87%
Mortgage Type
FHA
Estimated Equity
$150,984
Purchase Details
Closed on
Dec 21, 2004
Sold by
Ohara Carol K
Bought by
Capistrano Investments Llc
Purchase Details
Closed on
Jan 6, 2004
Sold by
Washington Mutual Bank Fa
Bought by
Secretary Of Veterans Affairs
Purchase Details
Closed on
Sep 27, 2001
Bought by
Russell Jerry S and Najla Annj
Create a Home Valuation Report for This Property
The Home Valuation Report is an in-depth analysis detailing your home's value as well as a comparison with similar homes in the area
Home Values in the Area
Average Home Value in this Area
Purchase History
| Date | Buyer | Sale Price | Title Company |
|---|---|---|---|
| Christmas Kyle J | $145,000 | -- | |
| Capistrano Investments Llc | -- | -- | |
| Ohara Carol K | -- | -- | |
| Secretary Of Veterans Affairs | $114,600 | -- | |
| Washington Mutual Bank Fa | $114,600 | -- | |
| Russell Jerry S | $134,900 | -- |
Source: Public Records
Mortgage History
| Date | Status | Borrower | Loan Amount |
|---|---|---|---|
| Open | Christmas Kyle J | $142,373 |
Source: Public Records
Tax History Compared to Growth
Tax History
| Year | Tax Paid | Tax Assessment Tax Assessment Total Assessment is a certain percentage of the fair market value that is determined by local assessors to be the total taxable value of land and additions on the property. | Land | Improvement |
|---|---|---|---|---|
| 2024 | $2,333 | $81,996 | $8,000 | $73,996 |
| 2023 | $2,115 | $73,834 | $8,000 | $65,834 |
| 2022 | $1,891 | $65,412 | $8,000 | $57,412 |
| 2021 | $1,878 | $62,540 | $8,000 | $54,540 |
| 2020 | $1,763 | $58,393 | $8,000 | $50,393 |
| 2019 | $1,705 | $58,393 | $8,000 | $50,393 |
| 2018 | $1,737 | $58,393 | $8,000 | $50,393 |
| 2017 | $1,727 | $58,393 | $8,000 | $50,393 |
| 2016 | $1,582 | $58,014 | $8,000 | $50,014 |
| 2015 | $1,585 | $58,014 | $8,000 | $50,014 |
| 2014 | $1,588 | $58,014 | $8,000 | $50,014 |
| 2013 | -- | $58,014 | $8,000 | $50,014 |
Source: Public Records
Map
Nearby Homes
- 72 Mountain Lake Ct
- 509 Sweetwater Dr
- 511 Sweetwater Dr
- 218 E East Bonacre Rd
- 508 Sweetwater Dr
- 95 Sweetwater Ct
- 131 Old Gate Rd
- 492 Mulberry Crossing Dr
- 654 Grey Rock Rd
- 1278 Jones Rd
- 595 Grey Rock Dr
- 654 Grey Rock Dr
- 172-6 Almond Ridge Dr
- 8000 Ivy Park Dr
- 921 Grey Smoke Trail
- 5905 Linley Ct
- 9536 English Ivy Ct
- 4677 Ivy Patch Dr
- 249 Serenity Loop
- 304 Maple Lakes Dr