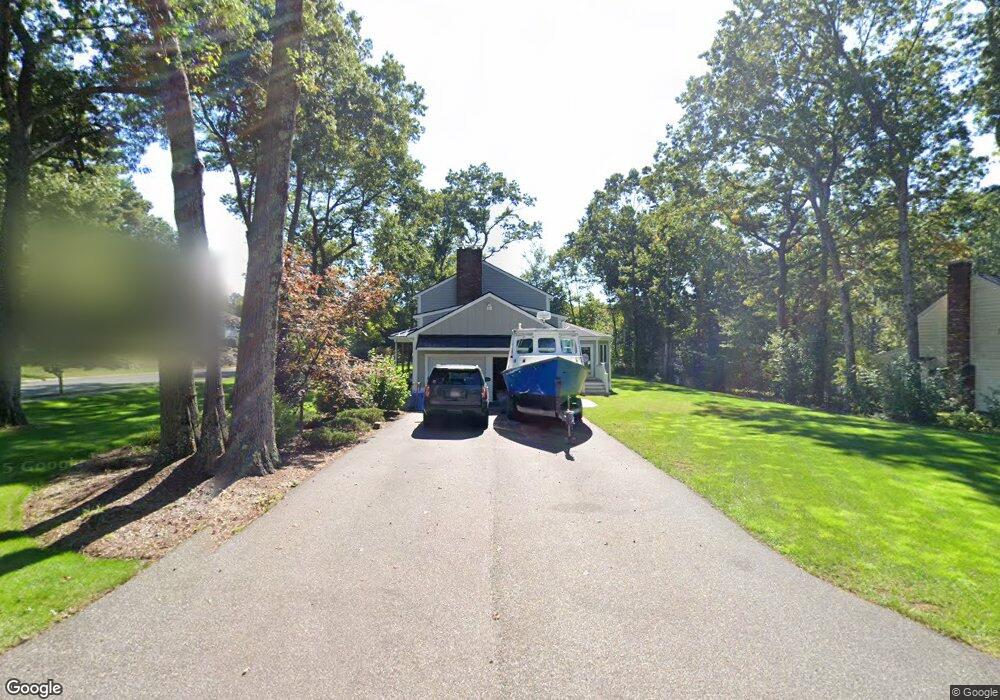
967 Maple St Mansfield, MA 02048
Estimated Value: $793,466 - $957,000
4
Beds
3
Baths
2,203
Sq Ft
$397/Sq Ft
Est. Value
About This Home
This home is located at 967 Maple St, Mansfield, MA 02048 and is currently estimated at $873,617, approximately $396 per square foot. 967 Maple St is a home located in Bristol County with nearby schools including Jordan/Jackson Elementary School, Everett W. Robinson Elementary School, and Harold L. Qualters Middle School.
Ownership History
Date
Name
Owned For
Owner Type
Purchase Details
Closed on
Jun 11, 2019
Sold by
Copithorne Mark
Bought by
Copithorne Jennifer and Copithorne Mark
Current Estimated Value
Purchase Details
Closed on
Mar 17, 2019
Sold by
Cavallo Jeanne M
Bought by
Copithorne Mark
Home Financials for this Owner
Home Financials are based on the most recent Mortgage that was taken out on this home.
Original Mortgage
$356,250
Interest Rate
4.4%
Mortgage Type
New Conventional
Purchase Details
Closed on
Jan 31, 1990
Sold by
Heinmille Stephen J
Bought by
Cavallo B Benjamin
Create a Home Valuation Report for This Property
The Home Valuation Report is an in-depth analysis detailing your home's value as well as a comparison with similar homes in the area
Home Values in the Area
Average Home Value in this Area
Purchase History
| Date | Buyer | Sale Price | Title Company |
|---|---|---|---|
| Copithorne Jennifer | -- | -- | |
| Copithorne Mark | $475,000 | -- | |
| Cavallo B Benjamin | $216,000 | -- |
Source: Public Records
Mortgage History
| Date | Status | Borrower | Loan Amount |
|---|---|---|---|
| Previous Owner | Copithorne Mark | $356,250 |
Source: Public Records
Tax History
| Year | Tax Paid | Tax Assessment Tax Assessment Total Assessment is a certain percentage of the fair market value that is determined by local assessors to be the total taxable value of land and additions on the property. | Land | Improvement |
|---|---|---|---|---|
| 2025 | $8,808 | $668,800 | $242,000 | $426,800 |
| 2024 | $8,308 | $615,400 | $242,000 | $373,400 |
| 2023 | $7,907 | $561,200 | $242,000 | $319,200 |
| 2022 | $7,590 | $500,300 | $224,000 | $276,300 |
| 2021 | $7,615 | $495,800 | $196,100 | $299,700 |
| 2020 | $7,351 | $478,600 | $186,800 | $291,800 |
| 2019 | $6,847 | $449,900 | $155,500 | $294,400 |
| 2018 | $6,525 | $437,500 | $148,300 | $289,200 |
| 2017 | $6,388 | $425,300 | $144,100 | $281,200 |
| 2016 | $6,113 | $396,700 | $137,200 | $259,500 |
| 2015 | $5,944 | $383,500 | $137,200 | $246,300 |
Source: Public Records
Map
Nearby Homes
- 26 Fredric Ln
- 260 Massapoag Ave
- 148 Stearns Ave
- 4 Erick Rd Unit 90
- 261 East St
- 34 Kevins Way
- 251 Poquanticut Ave
- 15 Coach Rd
- 26 Kathleen Grant Rd
- 45 Kingsbrook Way
- 157 Highland St
- 212 Mill St
- 6 Kingsley Rd
- 46 Hope St
- 9 Independence Dr Unit 9
- 619 N Main St
- 81 Chilson Ave
- 25 Kingman Ave
- 4 Concetta Cir
- 132 Cannon Forge Dr
Your Personal Tour Guide
Ask me questions while you tour the home.