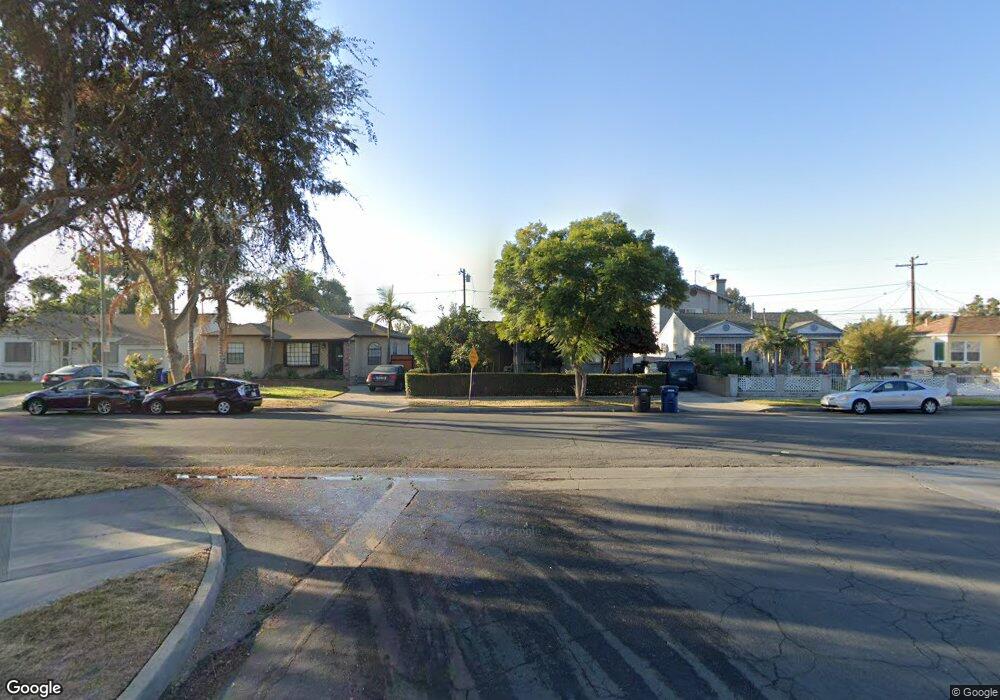
9674 Bascom St Pico Rivera, CA 90660
Estimated Value: $711,000 - $747,333
3
Beds
1
Bath
1,305
Sq Ft
$562/Sq Ft
Est. Value
About This Home
This home is located at 9674 Bascom St, Pico Rivera, CA 90660 and is currently estimated at $732,833, approximately $561 per square foot. 9674 Bascom St is a home located in Los Angeles County with nearby schools including Rivera Elementary School, El Rancho High School, and Ruben Salazar Continuation School.
Ownership History
Date
Name
Owned For
Owner Type
Purchase Details
Closed on
Jun 8, 2022
Sold by
Arthur Castellanos
Bought by
Santos David Anthony and Santos Ana Bertha
Current Estimated Value
Home Financials for this Owner
Home Financials are based on the most recent Mortgage that was taken out on this home.
Original Mortgage
$680,000
Outstanding Balance
$642,247
Interest Rate
5.1%
Mortgage Type
VA
Estimated Equity
$90,586
Purchase Details
Closed on
Apr 14, 2016
Sold by
Castellanos Robert
Bought by
Castellanos Arthur and Castellanos Victor
Purchase Details
Closed on
Dec 11, 2006
Sold by
Velasquez Steven
Bought by
Velasquez Becky
Purchase Details
Closed on
Dec 8, 2006
Sold by
Saxon Kyle Matthew
Bought by
Ancona Mary C
Purchase Details
Closed on
Nov 8, 2002
Sold by
Ancona Eduardo and Ancona Mary
Bought by
Ancona Eduardo
Purchase Details
Closed on
Jan 23, 1996
Sold by
Castellanos Robert and Castellanos Armida
Bought by
Castellanos Robert and Castellanos Armida
Create a Home Valuation Report for This Property
The Home Valuation Report is an in-depth analysis detailing your home's value as well as a comparison with similar homes in the area
Home Values in the Area
Average Home Value in this Area
Purchase History
| Date | Buyer | Sale Price | Title Company |
|---|---|---|---|
| Santos David Anthony | $680,000 | Fidelity National Title | |
| Lima Armida | -- | Fidelity National Title | |
| Castellanos Victor | -- | Fidelity National Title | |
| Castellanos Arthur | -- | Fidelity National Title | |
| Castellanos Arthur | -- | None Available | |
| Velasquez Becky | -- | Ticor Title Company Of Ca | |
| Ancona Mary C | -- | Ticor Title Company Of Ca | |
| Ancona Eduardo | -- | American Title Co | |
| Ancona Eduardo | -- | American Title Co | |
| Castellanos Robert | -- | -- |
Source: Public Records
Mortgage History
| Date | Status | Borrower | Loan Amount |
|---|---|---|---|
| Open | Santos David Anthony | $680,000 |
Source: Public Records
Tax History
| Year | Tax Paid | Tax Assessment Tax Assessment Total Assessment is a certain percentage of the fair market value that is determined by local assessors to be the total taxable value of land and additions on the property. | Land | Improvement |
|---|---|---|---|---|
| 2025 | $9,633 | $721,619 | $577,296 | $144,323 |
| 2024 | $9,633 | $707,471 | $565,977 | $141,494 |
| 2023 | $9,259 | $693,600 | $554,880 | $138,720 |
| 2022 | $1,588 | $61,769 | $25,381 | $36,388 |
| 2021 | $1,501 | $60,559 | $24,884 | $35,675 |
| 2019 | $1,475 | $58,765 | $24,147 | $34,618 |
| 2018 | $6,065 | $452,880 | $326,400 | $126,480 |
| 2016 | $1,101 | $55,378 | $22,755 | $32,623 |
| 2015 | $1,087 | $54,547 | $22,414 | $32,133 |
| 2014 | $1,085 | $53,479 | $21,975 | $31,504 |
Source: Public Records
Map
Nearby Homes
- 9522 Bascom St
- 7686 Sunflower Dr
- 7679 Sunflower Dr
- 7128 Farmland Ave
- 7705 Sage Dr
- 9346 Canford St
- 9273 Sierra Vista Cir
- 9515 Shade Ln
- 9213 Call St
- 7021 Passons Blvd
- 7019 Passons Blvd
- 7422 Bequette Ave
- 7840 Pioneer Blvd
- 7808 Pioneer Blvd
- 8320 Orange Ave
- 8328 Buhman Ave
- 9950 La Docena Ln
- 9734 Terradell St
- 8104 Arrington Ave
- 8905 Warvale St
- 9670 Bascom St
- 9702 Bascom St
- 9651 Woodhue St
- 9664 Bascom St
- 9708 Bascom St
- 9645 Woodhue St
- 9657 Woodhue St
- 9639 Woodhue St
- 9661 Woodhue St
- 9660 Bascom St
- 7429 Bennington Ave
- 7428 Bennington Ave
- 9714 Bascom St
- 9635 Woodhue St
- 9667 Woodhue St
- 7425 Bennington Ave
- 9654 Bascom St
- 7424 Bennington Ave
- 7426 Songfest Dr
- 9631 Woodhue St
Your Personal Tour Guide
Ask me questions while you tour the home.