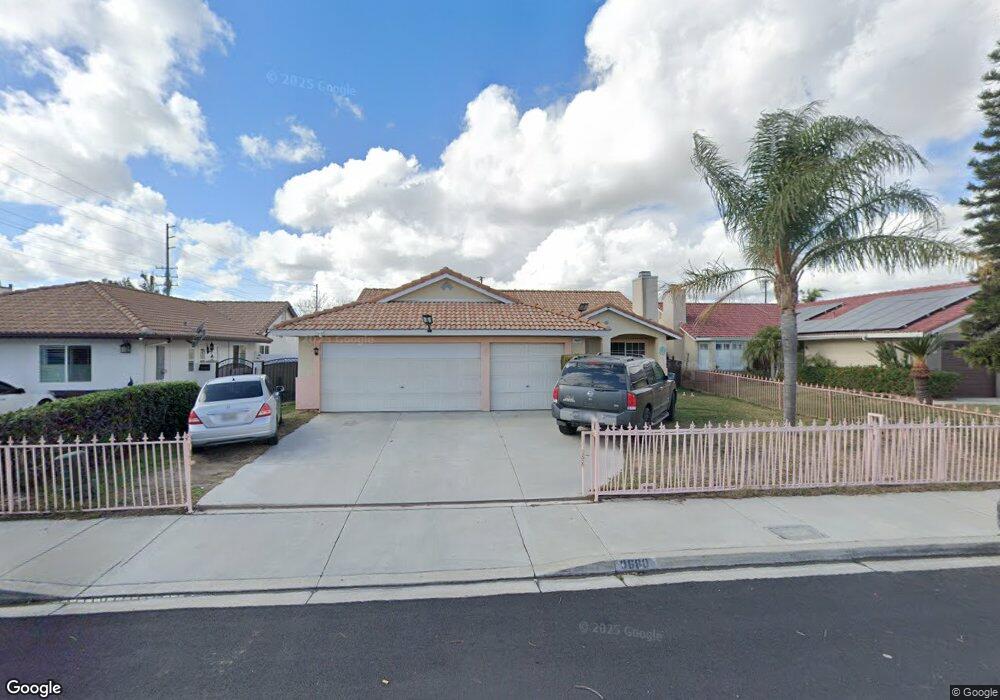
9680 Sunglow Ave Fontana, CA 92335
Estimated Value: $592,000 - $661,000
4
Beds
2
Baths
1,722
Sq Ft
$364/Sq Ft
Est. Value
About This Home
This home is located at 9680 Sunglow Ave, Fontana, CA 92335 and is currently estimated at $626,234, approximately $363 per square foot. 9680 Sunglow Ave is a home located in San Bernardino County with nearby schools including Beech Avenue Elementary School, Sequoia Middle School, and Fontana High School.
Ownership History
Date
Name
Owned For
Owner Type
Purchase Details
Closed on
Aug 26, 1999
Sold by
Hud
Bought by
Demeza Alejandro and Demeza Mercedes
Current Estimated Value
Home Financials for this Owner
Home Financials are based on the most recent Mortgage that was taken out on this home.
Original Mortgage
$110,791
Outstanding Balance
$33,022
Interest Rate
7.89%
Mortgage Type
FHA
Estimated Equity
$593,212
Purchase Details
Closed on
Mar 8, 1999
Sold by
Norwest Mtg Inc
Bought by
Hud
Purchase Details
Closed on
Mar 4, 1999
Sold by
Mazariegos Osmin A and Fajardo Gloria G
Bought by
Norwest Mtg Inc
Purchase Details
Closed on
Jun 7, 1996
Sold by
Young Homes
Bought by
Mazariegos Osmin A and Fajardo Gloria G
Home Financials for this Owner
Home Financials are based on the most recent Mortgage that was taken out on this home.
Original Mortgage
$144,428
Interest Rate
8.01%
Mortgage Type
FHA
Create a Home Valuation Report for This Property
The Home Valuation Report is an in-depth analysis detailing your home's value as well as a comparison with similar homes in the area
Home Values in the Area
Average Home Value in this Area
Purchase History
| Date | Buyer | Sale Price | Title Company |
|---|---|---|---|
| Demeza Alejandro | $111,000 | Gateway Title Company | |
| Hud | -- | Fidelity National Title Ins | |
| Norwest Mtg Inc | $153,304 | Fidelity National Title Ins | |
| Mazariegos Osmin A | $147,500 | Orange Coast Title |
Source: Public Records
Mortgage History
| Date | Status | Borrower | Loan Amount |
|---|---|---|---|
| Open | Demeza Alejandro | $110,791 | |
| Previous Owner | Mazariegos Osmin A | $144,428 |
Source: Public Records
Tax History Compared to Growth
Tax History
| Year | Tax Paid | Tax Assessment Tax Assessment Total Assessment is a certain percentage of the fair market value that is determined by local assessors to be the total taxable value of land and additions on the property. | Land | Improvement |
|---|---|---|---|---|
| 2025 | $1,784 | $170,603 | $41,499 | $129,104 |
| 2024 | $1,784 | $167,258 | $40,685 | $126,573 |
| 2023 | $1,738 | $163,978 | $39,887 | $124,091 |
| 2022 | $1,732 | $160,763 | $39,105 | $121,658 |
| 2021 | $1,710 | $157,611 | $38,338 | $119,273 |
| 2020 | $1,706 | $155,995 | $37,945 | $118,050 |
| 2019 | $1,654 | $152,936 | $37,201 | $115,735 |
| 2018 | $1,680 | $149,938 | $36,472 | $113,466 |
| 2017 | $1,670 | $146,998 | $35,757 | $111,241 |
| 2016 | $1,642 | $144,116 | $35,056 | $109,060 |
| 2015 | $1,622 | $141,951 | $34,529 | $107,422 |
| 2014 | $1,618 | $139,171 | $33,853 | $105,318 |
Source: Public Records
Map
Nearby Homes
- 9828 Carob Ave
- 15141 Randall Ave
- 9310 Carob St
- 9756 Elm Ave
- 9226 Cattail Ln
- 9153 Beech Ave
- 15413 Pine Ave
- 15317 Athol St
- 14582 El Molino St
- 15589 Randall Ave
- 14989 Hibiscus Ave
- 9408 Poplar Ave
- 9963 Eugenia Ave
- 9059 Beech Ave
- 10238 Cherry Ave
- 15278 Boyle Ave
- 15082 Valley Blvd
- 9833 Niagara Ave
- 15867 Randall Ave
- 15937 Manzanita Dr
- 9670 Sunglow Ave
- 9690 Sunglow Ave
- 9660 Sunglow Ave
- 15112 San Bernardino Ave
- 9669 Hemlock Ave
- 9650 Sunglow Ave
- 9659 Hemlock Ave
- 15154 Carmel St
- 15161 Carmel St
- 15151 Carmel St
- 9649 Hemlock Ave
- 9640 Sunglow Ave
- 15164 Carmel St
- 15119 San Bernardino Ave
- 9715 Hemlock Ave
- 15171 Carmel St
- 15147 San Bernardino Ave
- 9639 Hemlock Ave
- 15155 San Bernardino Ave
- 15157 Cambria St