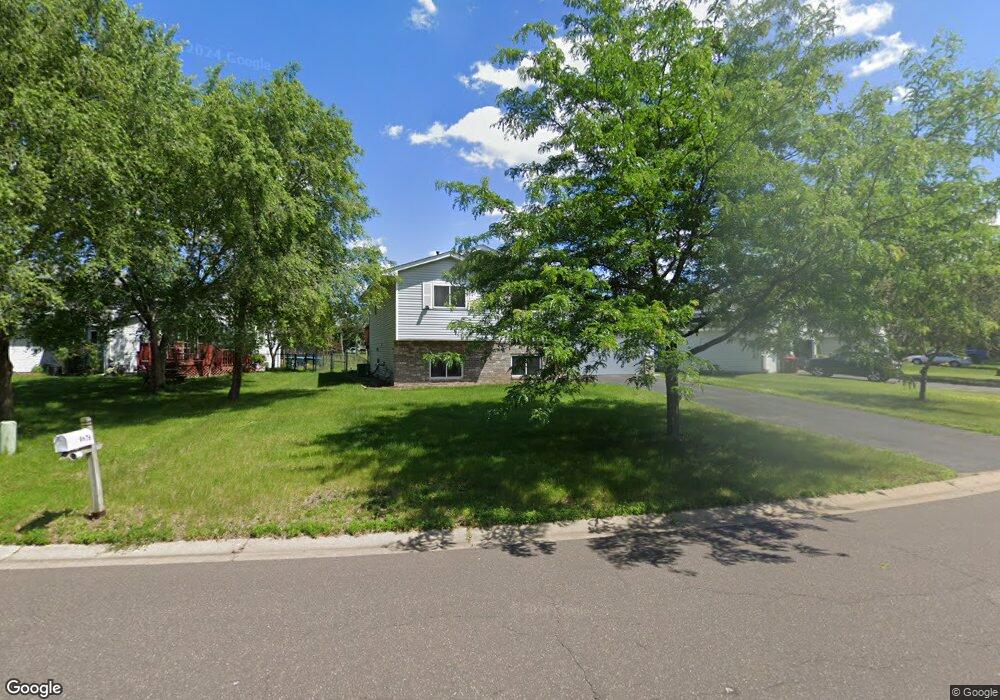
9683 Hamlet Ave S Cottage Grove, MN 55016
Estimated Value: $363,641 - $386,000
3
Beds
2
Baths
968
Sq Ft
$387/Sq Ft
Est. Value
About This Home
This home is located at 9683 Hamlet Ave S, Cottage Grove, MN 55016 and is currently estimated at $374,410, approximately $386 per square foot. 9683 Hamlet Ave S is a home located in Washington County with nearby schools including Pine Hill Elementary School, Oltman Middle School, and Park Senior High School.
Ownership History
Date
Name
Owned For
Owner Type
Purchase Details
Closed on
Sep 16, 2019
Sold by
Ly Nu
Bought by
Xiong Moua and Yang Sandy
Current Estimated Value
Home Financials for this Owner
Home Financials are based on the most recent Mortgage that was taken out on this home.
Original Mortgage
$266,750
Interest Rate
3.65%
Mortgage Type
New Conventional
Purchase Details
Closed on
Mar 31, 2016
Sold by
Boudjouk Peter J and Boudjouk Jeanette L
Bought by
Ly Nu and Xiong Lo X
Home Financials for this Owner
Home Financials are based on the most recent Mortgage that was taken out on this home.
Original Mortgage
$211,105
Interest Rate
3.5%
Mortgage Type
FHA
Purchase Details
Closed on
Aug 1, 2003
Sold by
Maddigan Craig Z and Maddigan Kyra E
Bought by
Boudjouk Peter J and Boudjouk Jeanette L
Purchase Details
Closed on
Apr 24, 1998
Sold by
Donovan Andrew A
Bought by
Maddigan Craig Z and Maddigan Kyra E
Create a Home Valuation Report for This Property
The Home Valuation Report is an in-depth analysis detailing your home's value as well as a comparison with similar homes in the area
Home Values in the Area
Average Home Value in this Area
Purchase History
| Date | Buyer | Sale Price | Title Company |
|---|---|---|---|
| Xiong Moua | $275,000 | Titlesmart Inc | |
| Ly Nu | $215,000 | Eagle Creek Title | |
| Boudjouk Peter J | $202,000 | -- | |
| Maddigan Craig Z | $113,200 | -- |
Source: Public Records
Mortgage History
| Date | Status | Borrower | Loan Amount |
|---|---|---|---|
| Previous Owner | Xiong Moua | $266,750 | |
| Previous Owner | Ly Nu | $211,105 |
Source: Public Records
Tax History Compared to Growth
Tax History
| Year | Tax Paid | Tax Assessment Tax Assessment Total Assessment is a certain percentage of the fair market value that is determined by local assessors to be the total taxable value of land and additions on the property. | Land | Improvement |
|---|---|---|---|---|
| 2024 | $4,086 | $329,400 | $100,000 | $229,400 |
| 2023 | $4,086 | $350,700 | $125,000 | $225,700 |
| 2022 | $3,524 | $315,400 | $102,800 | $212,600 |
| 2021 | $3,464 | $263,900 | $85,400 | $178,500 |
| 2020 | $3,416 | $262,400 | $91,000 | $171,400 |
| 2019 | $3,256 | $252,000 | $80,000 | $172,000 |
| 2018 | $3,100 | $235,700 | $75,000 | $160,700 |
| 2017 | $2,752 | $221,800 | $70,000 | $151,800 |
| 2016 | $2,794 | $202,400 | $58,000 | $144,400 |
| 2015 | $2,438 | $176,300 | $54,000 | $122,300 |
| 2013 | -- | $167,800 | $54,000 | $113,800 |
Source: Public Records
Map
Nearby Homes
- 7080 98th St S
- 9763 Dunes Ln
- 9842 Hayward Ave S
- 6888 98th St S
- 9926 Hamlet Ct S
- 9938 Hamlet Ct S
- 9983 Hamlet Ln S
- 9457 Hames Ave S
- 6603 97th Ct S
- 9325 Harkness Ave S
- 10254 Greystone Cir S
- 6699 93rd Alcove S
- 9176 Harkness Ave S
- 6911 92nd St S
- 10270 Goodview Cir S
- 10840 Hemingway Ave S
- 10663 Hemingway Ave S
- 6825 104th St S
- 6809 104th St S
- 10422 Goodview Ave S
- 9685 Hamlet Ave S
- 9675 Hamlet Ave S
- 9691 Hamlet Ave S
- 9671 Hamlet Ave S
- 9699 Hamlet Ave S
- 9667 Hamlet Ave S
- 9673 Hale Ave S
- 9682 Hamlet Ave S
- 9676 Hamlet Ave S
- 9688 Hamlet Ave S
- 9690 Hamlet Ave S
- 9670 Hallmark Ave S
- 9674 Hale Ave S
- 9663 Hamlet Ave S
- 9696 Hamlet Ave S
- 9665 Hale Ave S
- 9703 Hamlet Ave S
- 9668 Hallmark Ave S
- 9659 Hamlet Ave S
- 9659 Hale Ave S