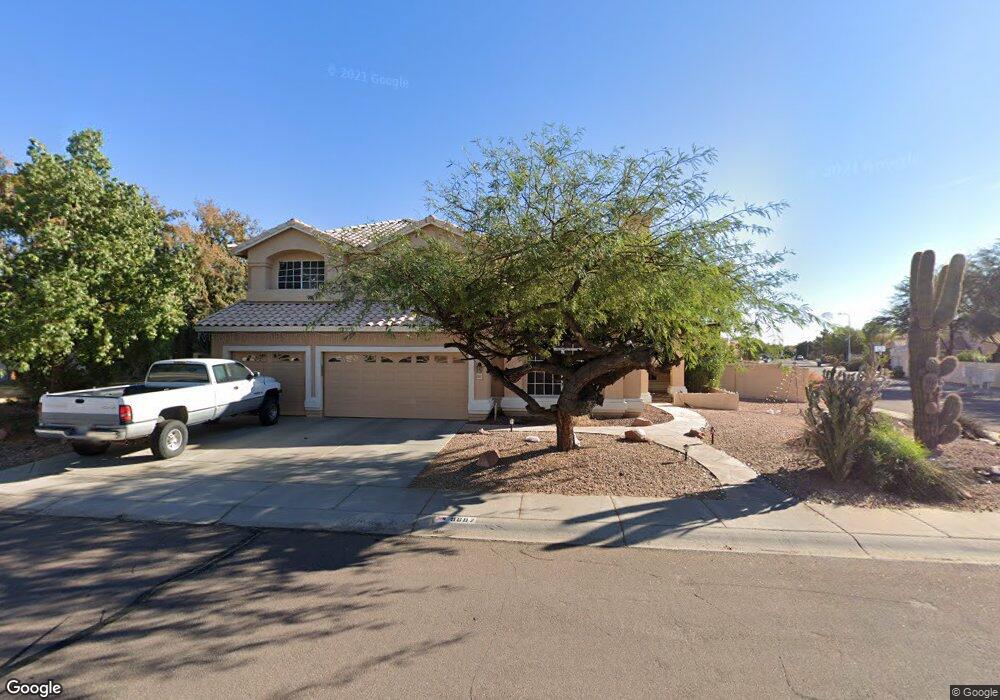
9687 S Darrow Dr Tempe, AZ 85284
West Chandler NeighborhoodEstimated Value: $770,428 - $847,000
Studio
4
Baths
3,529
Sq Ft
$230/Sq Ft
Est. Value
About This Home
This home is located at 9687 S Darrow Dr, Tempe, AZ 85284 and is currently estimated at $813,107, approximately $230 per square foot. 9687 S Darrow Dr is a home located in Maricopa County with nearby schools including Kyrene de las Manitas School, Kyrene del Pueblo Middle School, and Mountain Pointe High School.
Ownership History
Date
Name
Owned For
Owner Type
Purchase Details
Closed on
Mar 19, 1996
Sold by
Payne Richard D and Payne Mary Anne
Bought by
Burk Wendell C and Taruc Burk Corinna R
Current Estimated Value
Home Financials for this Owner
Home Financials are based on the most recent Mortgage that was taken out on this home.
Original Mortgage
$237,500
Interest Rate
7.62%
Mortgage Type
New Conventional
Purchase Details
Closed on
Apr 14, 1995
Sold by
Continental Homes Inc
Bought by
Payne Richard D and Payne Mary Anne
Home Financials for this Owner
Home Financials are based on the most recent Mortgage that was taken out on this home.
Original Mortgage
$202,300
Interest Rate
8.77%
Mortgage Type
New Conventional
Purchase Details
Closed on
Oct 10, 1994
Sold by
Chi Construction Company
Bought by
Continental Homes Inc
Create a Home Valuation Report for This Property
The Home Valuation Report is an in-depth analysis detailing your home's value as well as a comparison with similar homes in the area
Home Values in the Area
Average Home Value in this Area
Purchase History
| Date | Buyer | Sale Price | Title Company |
|---|---|---|---|
| Burk Wendell C | $249,900 | First American Title | |
| Payne Richard D | $214,257 | First American Title | |
| Continental Homes Inc | -- | First American Title | |
| Chi Construction Company | -- | First American Title |
Source: Public Records
Mortgage History
| Date | Status | Borrower | Loan Amount |
|---|---|---|---|
| Previous Owner | Burk Wendell C | $237,500 | |
| Previous Owner | Payne Richard D | $202,300 |
Source: Public Records
Tax History
| Year | Tax Paid | Tax Assessment Tax Assessment Total Assessment is a certain percentage of the fair market value that is determined by local assessors to be the total taxable value of land and additions on the property. | Land | Improvement |
|---|---|---|---|---|
| 2025 | $4,795 | $49,480 | -- | -- |
| 2024 | $4,502 | $47,124 | -- | -- |
| 2023 | $4,502 | $59,010 | $11,800 | $47,210 |
| 2022 | $4,266 | $44,770 | $8,950 | $35,820 |
| 2021 | $4,374 | $42,760 | $8,550 | $34,210 |
| 2020 | $4,264 | $41,610 | $8,320 | $33,290 |
| 2019 | $4,120 | $40,730 | $8,140 | $32,590 |
| 2018 | $3,976 | $39,280 | $7,850 | $31,430 |
| 2017 | $3,801 | $37,800 | $7,560 | $30,240 |
| 2016 | $3,840 | $39,510 | $7,900 | $31,610 |
| 2015 | $3,523 | $35,380 | $7,070 | $28,310 |
Source: Public Records
Map
Nearby Homes
- 7045 W Carter Dr
- 1250 N Abbey Ln Unit 209
- 1250 N Abbey Ln Unit 124
- 1061 W Courtney Ln
- 6762 W Shannon St
- 6852 W Ivanhoe St
- 1122 W Dawn Dr
- 7061 W Linda Ln
- 6551 W Shannon Ct Unit 1
- 7097 W Ivanhoe St
- 6670 W Del Rio St
- 1132 N Roosevelt Ave
- 687 N Gregory Place
- 6923 W Laredo St
- 6943 W Laredo St Unit 2
- 624 N Dustin Ln
- 5005 E Shomi St
- 448 W Larona Ln
- 12850 S 50th Way
- 500 N Roosevelt Ave Unit 66
- 9665 S Darrow Dr
- 1406 W Stacey Ln
- 9725 S Darrow Dr
- 9690 S Darrow Dr
- 1392 W Stacey Ln
- 1387 W Larona Ln
- 9668 S Darrow Dr
- 9643 S Darrow Dr
- 9737 S Darrow Dr
- 9722 S Darrow Dr
- 1391 W Stacey Ln
- 9648 S Margo Dr
- 1378 W Stacey Ln
- 9646 S Darrow Dr
- 9734 S Darrow Dr
- 9749 S Darrow Dr Unit 1
- 1373 W Larona Ln Unit 1
- 9621 S Darrow Dr
- 1379 W Stacey Ln Unit 1
- 9624 S Darrow Dr
Your Personal Tour Guide
Ask me questions while you tour the home.