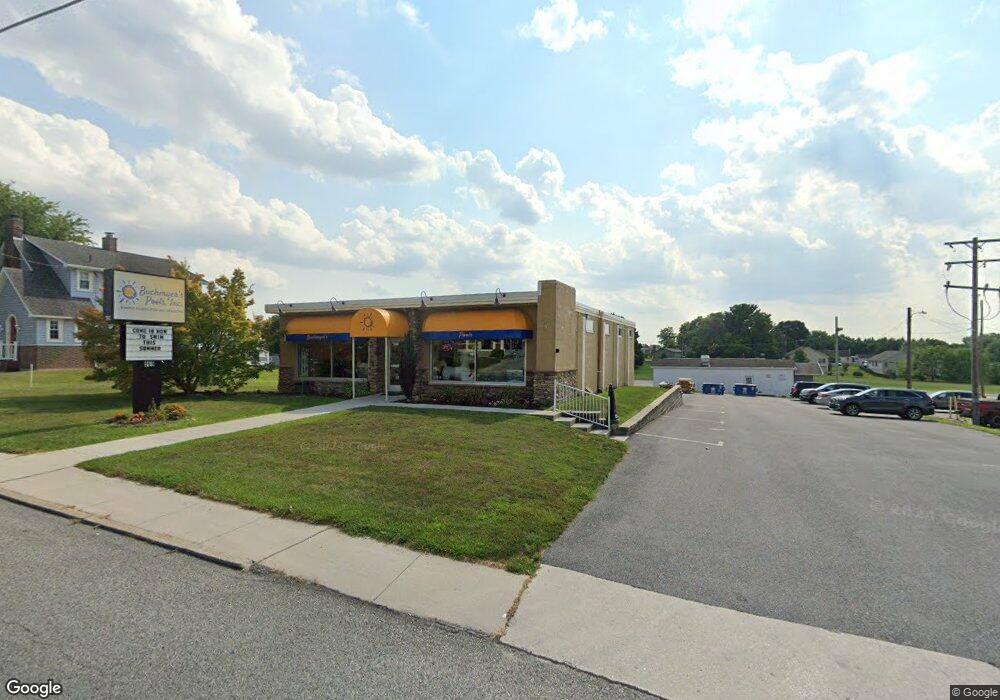
969 Baltimore St Hanover, PA 17331
Estimated Value: $691,113
Studio
--
Bath
5,460
Sq Ft
$127/Sq Ft
Est. Value
About This Home
This home is located at 969 Baltimore St, Hanover, PA 17331 and is currently estimated at $691,113, approximately $126 per square foot. 969 Baltimore St is a home located in York County with nearby schools including South Western Senior High School and St Joseph Catholic School.
Ownership History
Date
Name
Owned For
Owner Type
Purchase Details
Closed on
Jan 11, 2013
Sold by
Promise Land Investments Llc
Bought by
Buchmyer Real Estate Lp
Current Estimated Value
Home Financials for this Owner
Home Financials are based on the most recent Mortgage that was taken out on this home.
Original Mortgage
$35,000
Outstanding Balance
$24,347
Interest Rate
3.38%
Mortgage Type
Commercial
Estimated Equity
$666,766
Purchase Details
Closed on
Jan 15, 2009
Sold by
Forbes Tony R and Forbes Bonnie S
Bought by
Promise Land Investments Llc
Purchase Details
Closed on
Oct 3, 2008
Sold by
Forbes Timothy L
Bought by
Forbes Tony R
Purchase Details
Closed on
Apr 8, 2003
Sold by
Forbes Tony R and Forbes Bonnie S
Bought by
Forbes Timothy L
Home Financials for this Owner
Home Financials are based on the most recent Mortgage that was taken out on this home.
Original Mortgage
$180,000
Interest Rate
5.86%
Mortgage Type
Commercial
Create a Home Valuation Report for This Property
The Home Valuation Report is an in-depth analysis detailing your home's value as well as a comparison with similar homes in the area
Home Values in the Area
Average Home Value in this Area
Purchase History
| Date | Buyer | Sale Price | Title Company |
|---|---|---|---|
| Buchmyer Real Estate Lp | $350,000 | None Available | |
| Promise Land Investments Llc | $425,000 | None Available | |
| Forbes Tony R | $375,000 | None Available | |
| Forbes Timothy L | $200,000 | -- |
Source: Public Records
Mortgage History
| Date | Status | Borrower | Loan Amount |
|---|---|---|---|
| Open | Buchmyer Real Estate Lp | $35,000 | |
| Previous Owner | Forbes Timothy L | $180,000 | |
| Closed | Forbes Timothy L | $20,000 |
Source: Public Records
Tax History
| Year | Tax Paid | Tax Assessment Tax Assessment Total Assessment is a certain percentage of the fair market value that is determined by local assessors to be the total taxable value of land and additions on the property. | Land | Improvement |
|---|---|---|---|---|
| 2025 | $7,392 | $219,350 | $76,450 | $142,900 |
| 2024 | $7,392 | $219,350 | $76,450 | $142,900 |
| 2023 | $7,260 | $219,350 | $76,450 | $142,900 |
| 2022 | $7,105 | $219,350 | $76,450 | $142,900 |
| 2021 | $6,717 | $219,350 | $76,450 | $142,900 |
| 2020 | $6,717 | $219,350 | $76,450 | $142,900 |
| 2019 | $6,587 | $219,350 | $76,450 | $142,900 |
| 2018 | $6,500 | $219,350 | $76,450 | $142,900 |
| 2017 | $6,350 | $219,350 | $76,450 | $142,900 |
| 2016 | $0 | $219,350 | $76,450 | $142,900 |
| 2015 | -- | $219,350 | $76,450 | $142,900 |
| 2014 | -- | $219,350 | $76,450 | $142,900 |
Source: Public Records
Map
Nearby Homes
- 917 Baltimore St
- 11 Narrow Rd
- 10 Cantera Way
- 400 Ripple Dr Unit 56
- 1280 Maple Ln Unit 10
- 21 Meadow Ln Unit 20
- 500 Ripple Dr Unit 51
- 25 Meadow Ln Unit 22
- 6 Little Way Unit 64
- 1240 Maple Ln Unit 14
- 1 Little Way Unit 79
- 24 Meadow Ln Unit 18
- 5 Little Way Unit 65
- 201 Fieldstone Dr Unit 23
- 560 Ripple Dr Unit 45
- 12 Oneill Ave
- 55 Wilmar Ave Unit 12
- 1511 Maple Ln Unit 185
- 1521 Maple Ln Unit 186
- 625 Ripple Dr Unit 187
- 973 Baltimore St
- 975 Baltimore St
- 968 Baltimore St
- 955 Baltimore St
- 979 Baltimore St
- 970 Baltimore St
- 981 Baltimore St
- 972 Baltimore St
- 972 Baltimore St
- 972.5 Baltimore St
- 983 Baltimore St
- 985 Baltimore St
- 950 Baltimore St
- 982 Baltimore St
- 947 Baltimore St
- 987 Baltimore St
- 107 Clover Ln Unit LN
- 107 Clover Ln
- 986 Baltimore St
- 80 Janet St
Your Personal Tour Guide
Ask me questions while you tour the home.