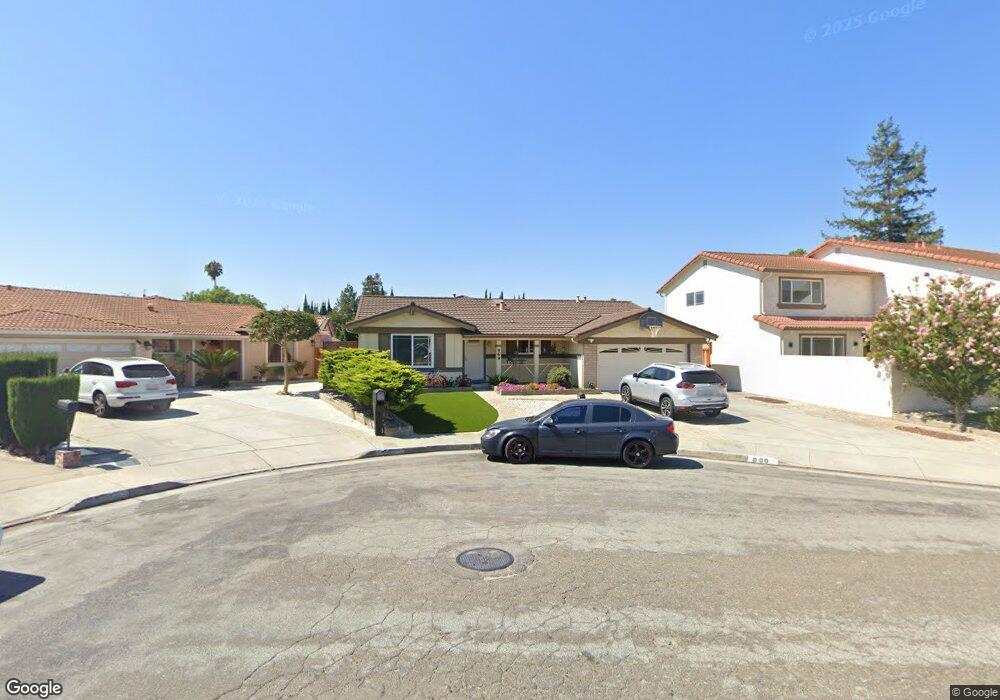
969 Cadet Place San Jose, CA 95133
Commodore NeighborhoodEstimated Value: $1,431,000 - $1,896,000
4
Beds
2
Baths
1,843
Sq Ft
$889/Sq Ft
Est. Value
About This Home
This home is located at 969 Cadet Place, San Jose, CA 95133 and is currently estimated at $1,638,194, approximately $888 per square foot. 969 Cadet Place is a home located in Santa Clara County with nearby schools including Vinci Park Elementary School, Piedmont Middle School, and Independence High School.
Ownership History
Date
Name
Owned For
Owner Type
Purchase Details
Closed on
Oct 24, 2002
Sold by
Luciw Rosie
Bought by
Le Sabrina Xuan
Current Estimated Value
Home Financials for this Owner
Home Financials are based on the most recent Mortgage that was taken out on this home.
Original Mortgage
$300,000
Interest Rate
5.37%
Purchase Details
Closed on
Mar 19, 1998
Sold by
Brown James C
Bought by
Brown James C and Brown Lauralee A
Home Financials for this Owner
Home Financials are based on the most recent Mortgage that was taken out on this home.
Original Mortgage
$100,000
Interest Rate
7.06%
Purchase Details
Closed on
Mar 18, 1998
Sold by
Brown Lauralee A
Bought by
Brown James C
Home Financials for this Owner
Home Financials are based on the most recent Mortgage that was taken out on this home.
Original Mortgage
$100,000
Interest Rate
7.06%
Create a Home Valuation Report for This Property
The Home Valuation Report is an in-depth analysis detailing your home's value as well as a comparison with similar homes in the area
Home Values in the Area
Average Home Value in this Area
Purchase History
| Date | Buyer | Sale Price | Title Company |
|---|---|---|---|
| Le Sabrina Xuan | $395,000 | Fidelity National Title Ins | |
| Brown James C | -- | -- | |
| Brown James C | -- | All Cal Title Company |
Source: Public Records
Mortgage History
| Date | Status | Borrower | Loan Amount |
|---|---|---|---|
| Closed | Le Sabrina Xuan | $300,000 | |
| Closed | Brown James C | $100,000 |
Source: Public Records
Tax History Compared to Growth
Tax History
| Year | Tax Paid | Tax Assessment Tax Assessment Total Assessment is a certain percentage of the fair market value that is determined by local assessors to be the total taxable value of land and additions on the property. | Land | Improvement |
|---|---|---|---|---|
| 2025 | $3,453 | $157,734 | $31,386 | $126,348 |
| 2024 | $3,453 | $154,642 | $30,771 | $123,871 |
| 2023 | $3,351 | $151,611 | $30,168 | $121,443 |
| 2022 | $3,324 | $148,639 | $29,577 | $119,062 |
| 2021 | $3,178 | $145,726 | $28,998 | $116,728 |
| 2020 | $3,048 | $144,233 | $28,701 | $115,532 |
| 2019 | $2,925 | $141,406 | $28,139 | $113,267 |
| 2018 | $2,866 | $138,635 | $27,588 | $111,047 |
| 2017 | $2,854 | $135,918 | $27,048 | $108,870 |
| 2016 | $2,730 | $133,254 | $26,518 | $106,736 |
| 2015 | $2,687 | $131,253 | $26,120 | $105,133 |
| 2014 | $2,215 | $128,683 | $25,609 | $103,074 |
Source: Public Records
Map
Nearby Homes
- 1055 Thyme Walkway
- 1087 Yarrow Terrace
- 1049 Branbury Way
- 1137 Mallow Terrace
- 2328 Mossdale Way
- 2324 Mossdale Way
- 2109 Kiwi Walkway
- 2044 Voss Park Ln
- 832 N Jackson Ave
- 1957 Cape Horn Dr
- 2369 Mabury Rd
- 12280 Mabury Rd
- 985 Harcot Ct
- 990 Harcot Ct
- 970 E Harcot Ct
- Residence 2 Plan at Ascend
- Residence 1 Plan at Ascend
- Residence 3 Plan at Ascend
- 997 Harcot Ct
- 981 Harcot Ct
- 975 Cadet Place
- 963 Cadet Place
- 972 Ketch Place
- 957 Cadet Place
- 978 Ketch Place
- 981 Cadet Place
- 966 Ketch Place
- 984 Ketch Place
- 958 Cadet Place
- 970 Cadet Place
- 964 Cadet Place
- 2103 Commodore Dr
- 2095 Commodore Dr
- 987 Cadet Place
- 2111 Commodore Dr
- 976 Cadet Place
- 2087 Commodore Dr
- 990 Ketch Place
- 967 Ketch Place
- 982 Cadet Place