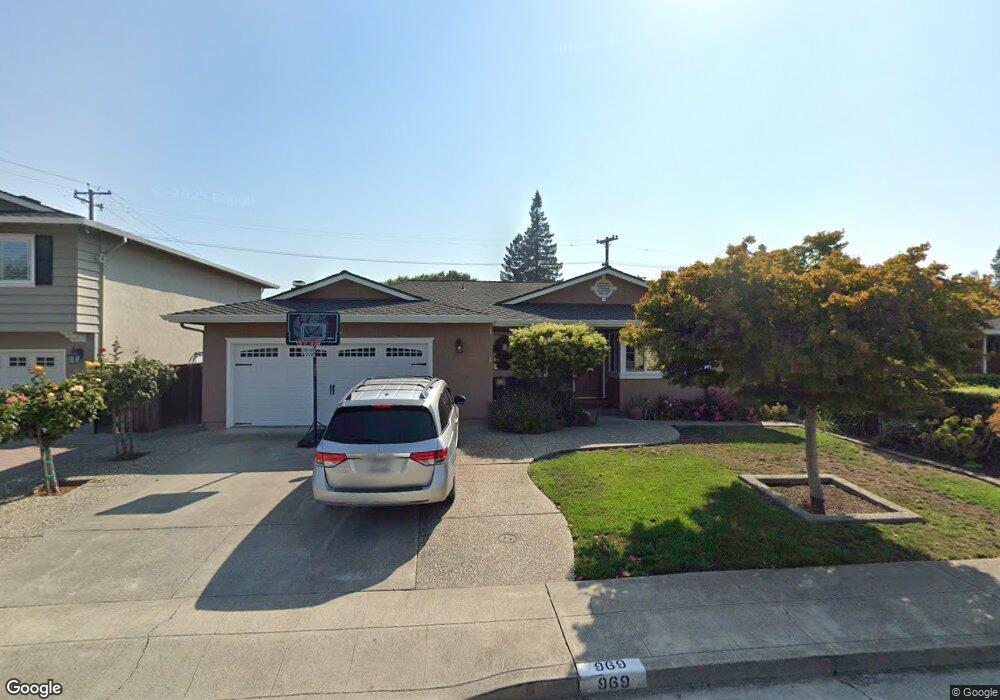
969 Capitola Way Santa Clara, CA 95051
Estimated Value: $2,033,000 - $2,538,000
3
Beds
2
Baths
1,733
Sq Ft
$1,294/Sq Ft
Est. Value
About This Home
This home is located at 969 Capitola Way, Santa Clara, CA 95051 and is currently estimated at $2,242,587, approximately $1,294 per square foot. 969 Capitola Way is a home located in Santa Clara County with nearby schools including Pomeroy Elementary School, Juan Cabrillo Middle School, and Santa Clara High School.
Ownership History
Date
Name
Owned For
Owner Type
Purchase Details
Closed on
Jul 13, 2005
Sold by
Christensen Gary L and Christensen Angele J
Bought by
Christensen Gary L and Christensen Angele J
Current Estimated Value
Create a Home Valuation Report for This Property
The Home Valuation Report is an in-depth analysis detailing your home's value as well as a comparison with similar homes in the area
Home Values in the Area
Average Home Value in this Area
Purchase History
| Date | Buyer | Sale Price | Title Company |
|---|---|---|---|
| Christensen Gary L | -- | -- |
Source: Public Records
Tax History Compared to Growth
Tax History
| Year | Tax Paid | Tax Assessment Tax Assessment Total Assessment is a certain percentage of the fair market value that is determined by local assessors to be the total taxable value of land and additions on the property. | Land | Improvement |
|---|---|---|---|---|
| 2025 | $5,375 | $466,436 | $172,252 | $294,184 |
| 2024 | $5,375 | $457,291 | $168,875 | $288,416 |
| 2023 | $5,319 | $448,325 | $165,564 | $282,761 |
| 2022 | $5,231 | $439,535 | $162,318 | $277,217 |
| 2021 | $5,208 | $430,918 | $159,136 | $271,782 |
| 2020 | $5,112 | $426,501 | $157,505 | $268,996 |
| 2019 | $5,105 | $418,139 | $154,417 | $263,722 |
| 2018 | $4,779 | $409,941 | $151,390 | $258,551 |
| 2017 | $4,753 | $401,904 | $148,422 | $253,482 |
| 2016 | $4,688 | $394,024 | $145,512 | $248,512 |
| 2015 | $4,668 | $388,107 | $143,327 | $244,780 |
| 2014 | $4,428 | $380,506 | $140,520 | $239,986 |
Source: Public Records
Map
Nearby Homes
- 840 Quince Ave Unit 27
- 836 Pomeroy Ave Unit 70
- 834 Quince Ave Unit 37
- 3033 Kaiser Dr Unit H
- 960 Kiely Blvd Unit F
- 1496 Mcpherson St
- 1545 Pomeroy Ave
- 1155 London Ave
- 940 Kiely Blvd Unit H
- 986 Kiely Blvd Unit D
- 3513 Oxford Ct
- 2971 Salem Dr
- 1014 Teal Dr
- 1661 Nobili Ave
- 1105 Lorne Way
- 2782 Sonoma Place
- 3089 El Camino Real Unit 9
- 3089 El Camino Real Unit 7
- 3089 El Camino Real Unit 5
- 3089 El Camino Real Unit 11
- 959 Capitola Way
- 975 Capitola Way
- 3376 Solano Ct
- 979 Capitola Way
- 3366 Solano Ct
- 949 Capitola Way
- 945 Capitola Way
- 978 Capitola Way
- 974 Capitola Way
- 3367 Solano Ct
- 939 Capitola Way
- 970 Capitola Way
- 3356 Solano Ct
- 980 Capitola Way
- 935 Capitola Way
- 3357 Solano Ct
- 964 Capitola Way
- 989 Capitola Way
- 965 Curtis Ave
- 986 Capitola Way